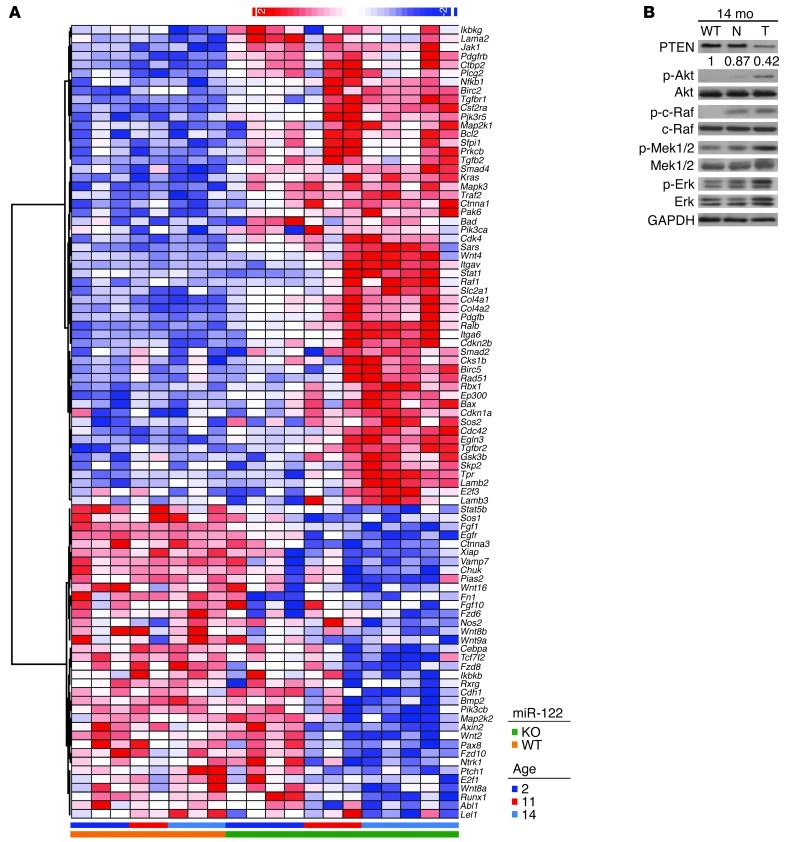
Figure 6. Expression profiling of the genes in the KEGG Pathways in Cancer set.
(A) The heat map shows the 91 genes in the KEGG Pathways in Cancer that are differentially expressed in the livers of 2-month-old mice and tumor tissues from 11-month- and 14-month-old male Mir122a–/– mice (cutoff, 1.5). The heat scale of the map represents changes on a linear scale. Red and blue denote upregulated and downregulated gene expression, respectively. Relative expression levels of the genes in the KEGG Pathway in Cancer gene set are listed in Supplemental Table 5. (B) Activation of the Akt and MAPK pathways in Mir122a–/– mice. WT, normal livers from 14-month-old mice; N, tumor-adjacent tissues; T, tumor. A representative of 3 independent experiments is shown. Values represent the relative levels of PTEN protein expression between WT and the tumor-adjacent tissues (N) or the tumor tissues (T) of Mir122a–/– livers.

