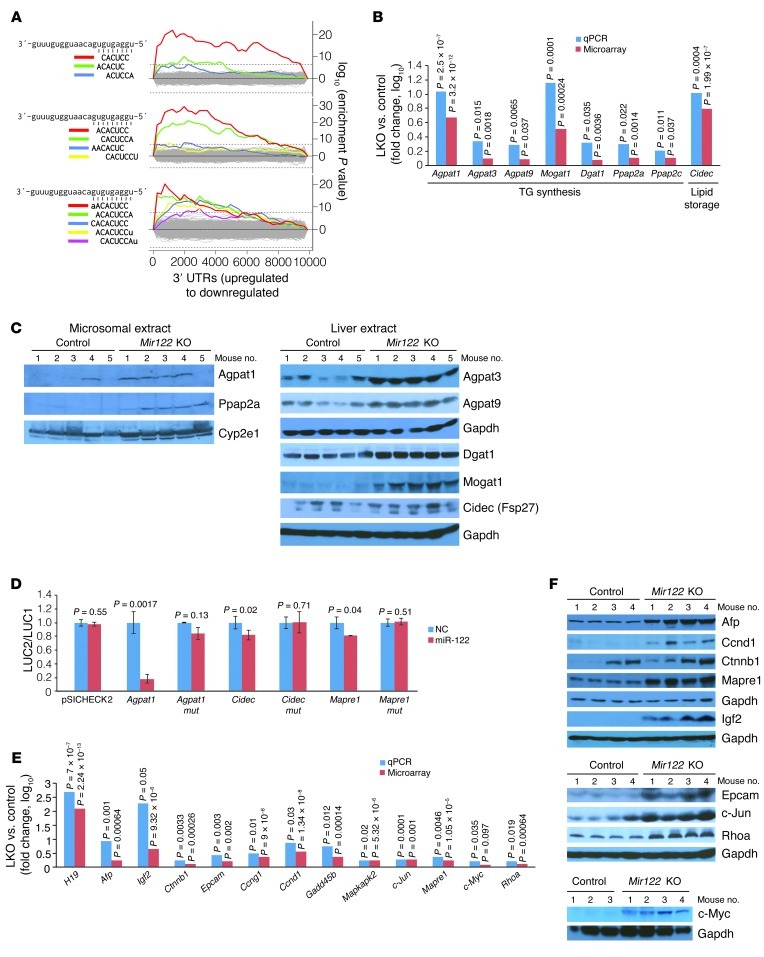
Figure 2. Altered expression of genes involved in TG metabolism and hepatocarcinogenesis in Mir122-LKO livers.
(A) Sylamer plots (17) showing the enriched hexamers (top), heptamers (middle), and octamers (bottom) in transcripts that are upregulated in LKO livers. All motifs that are statistically significantly enriched are highlighted in color on the plots and correspond to binding sites for the miR-122 seed sequence as shown on the left. (B) Expression of genes involved in TG synthesis and storage in LKO livers. For this and subsequent panels, real-time RT-PCR values represent means from triplicate measurements with multiple samples (n = 4–5). Statistical significance was calculated using a 2-tailed t test. (C) Western blot analysis of microsomal or whole liver extracts. (D) Renilla luciferase activity (LUC2) produced from wild-type or mutant (mut) Agpat1, Cidec, and Mapre1 3′ UTR reporter plasmids or empty vector (pSICHECK2) normalized to firefly luciferase activity (LUC1) produced from the same plasmid after transfection into Hepa cells together with negative control RNA (NC) or miR-122 mimic. Error bars represent SDs derived from 3 independent experiments. (E and F) Expression of transcripts (E) and proteins (F) related to hepatocarcinogenesis in LKO/KO livers.

