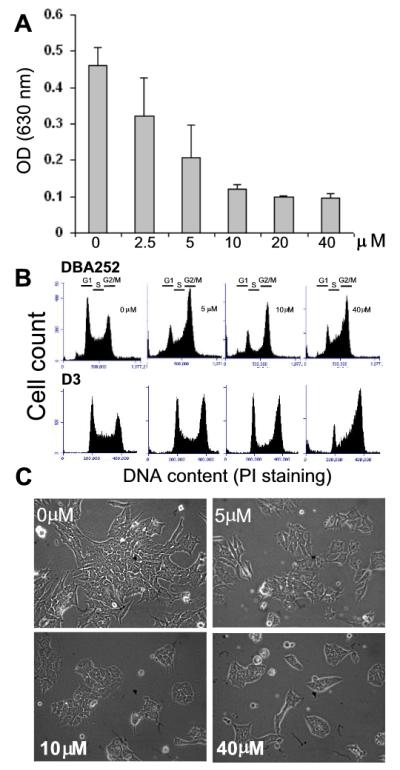
Figure 1.

Effects of Olo II on cell proliferation, cell cycle progression, and cell morphology. DBA252 or D3 mESCs were seeded in 6-well plates (6.5 ×10⁴/well). After incubating for 24 h, cells were treated with different concentrations of Olo II for 24 h. A, DBA252 cell proliferation was determined by the absorbance at 630 nm, which correlates with the number of cells. The results are mean ± SD from three independent experiments. Similar results were obtained with D3 cells. B, Cell cycle profile analysis by flow cytometry. C, Microscopic analysis of cell and colony morphology of DBA 252 cells under a phase contrast microscope.
