Figure 4.

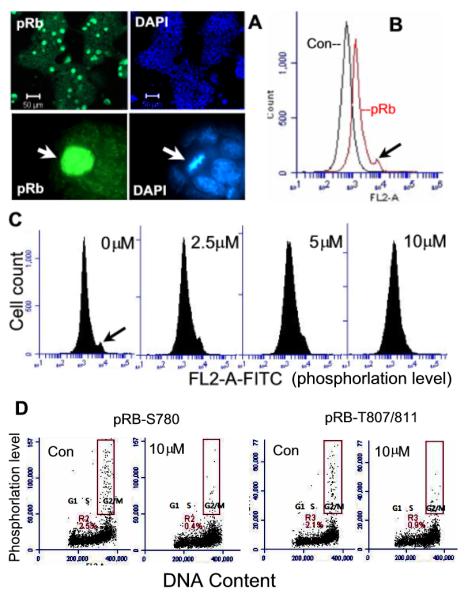
Rb phosphorylation and the effect of Olo II. A, Detection of hyperphosphorylated Rb (pRb-S780) by fluorescence microscopic analysis of DBA 252 cells labeled with anti-pRb antibodies and DAPI. The arrow indicates a single cell with intensive fluorescence staining of pRb, which is at the mitotic phase identified by its condensed mitotic chromosomes (DAPI). B, Flow cytometry analysis of pRb. Control (Con) represents the cells without first antibody incubation. pRb-S780 is detected as a shoulder peak (the cell population with the strongest fluorescence intensity, indicated by arrow). C, Olo II-induced dephosphorylation of pRb. Cells were treated with Olo II at different concentrations for 24 h. Dephosphorylation was indicated by the disappearance of the shoulder peak in the flow cytometry profiles. D, Dual analysis of Rb phosphorylation and cell cycle by flow cytometry. DBA 252 cells treated with Olo II for 24 h or control cells were doubly labeled with anti-Rb-S780 or anti-Rb-T807/811 antibodies to detect pRb and PI to detect DNA. Nearly all pRb positive cells are in G2/M phases and shown in the boxed areas.
