Figure 6.

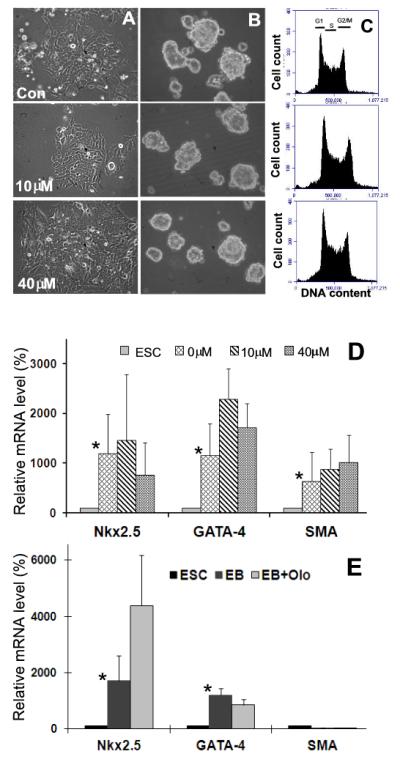
Recovery of mESCs from Olo II treatment. A, DBA 252 cells were treated with 10 μM or 40 μM Olo II. The cells were then cultured in the fresh medium for 5 and 10 days, respectively, and photographed under a phase contrast microscope. B, Five day old EBs formed from control cells and cells recovered from Olo II treatment as shown in A. C, The cell cycle profiles of the cells shown in A were determined by flow cytometry. D, The differentiation capacities of EBs shown in B were determined by the expression of three differentiation markers. The mRNA level of each gene was determined by qRT-PCR and compared with its mRNA level in undifferentiated ESCs (designated as 100%). The results are means ± SD of three independent experiments. E, The same experiments were performed with D3 cells. EB and EB+Olo are EBs formed from control cells and cells recovered from Olo II treatment (10 μM), respectively. In both D and E, the differences in the expression of tested genes between ESCs and EBs are statistically significant (* p<0.05, with the exception of SMA in D), but the differences between control EBs and Olo II treated EBs are not.
