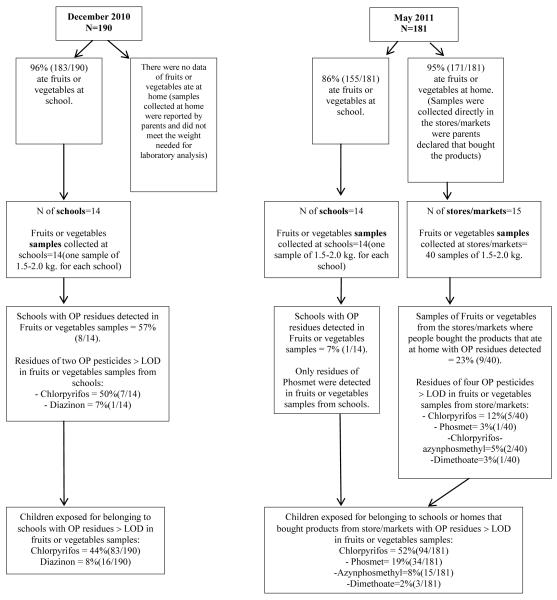
Figure 3.
Diagram of the results of OP residues on vegetables/fruits in summer (December 2010) and fall (May 2011) samplings, depicting the number of children that ate produce and the samples of food taken, the pesticide residues above the LOD on produce and the number of children estimated to be exposed to these residues.

