
Figure 1. MCT1 expressed primarily within oligodendroglia in the CNS.
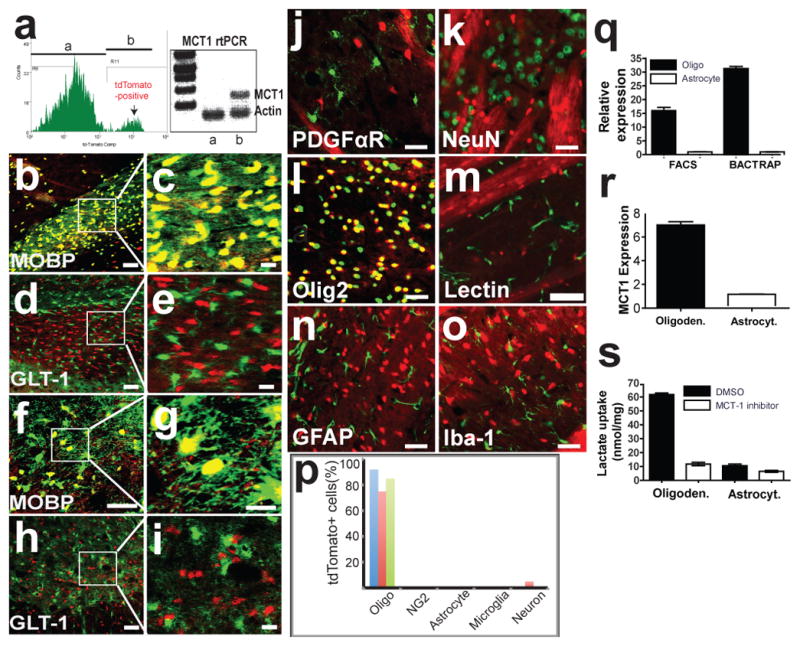
(a) Histogram and rtPCR for MCT1 mRNA from FAC sorted cells with (b) or without (a) tdTomato expression. (b–e) Corpus callosum of tdTomato MCT1 reporter mice crossed with BAC-MOBP eGFP (b,c) or BAC-GLT1 eGFP (d,e) mice. (f–i) Spinal cord of tdTomato MCT1 reporter mice crossed with BAC-MOBP eGFP (f,g) or BAC-GLT1 eGFP (h,i) mice (Scale bars = 50 and 14 μm for low and high power, respectively). (j–o) TdTomato MCT1 reporter mouse brain immunostained with cell-specific markers (scale bars = 12.5 μm, except 50 μm for lectin). (p) Percentage of tdTomato cells co-labelled with CNS cell markers in the spinal cord (blue), cortex (red), and corpus callosum (green). (q,r) Real-time rtPCR of MCT1 mRNA isolated from oligodendroglia and astroglia by FACS and BacTRAP techniques (q; means of 4 replicates) and human oligodendroglioma (M03.13) and astrocytoma (U87) cell lines (r). (s) Lactate transport and blockade by selective MCT1 inhibitor in oligodendroglioma and astrocytoma.