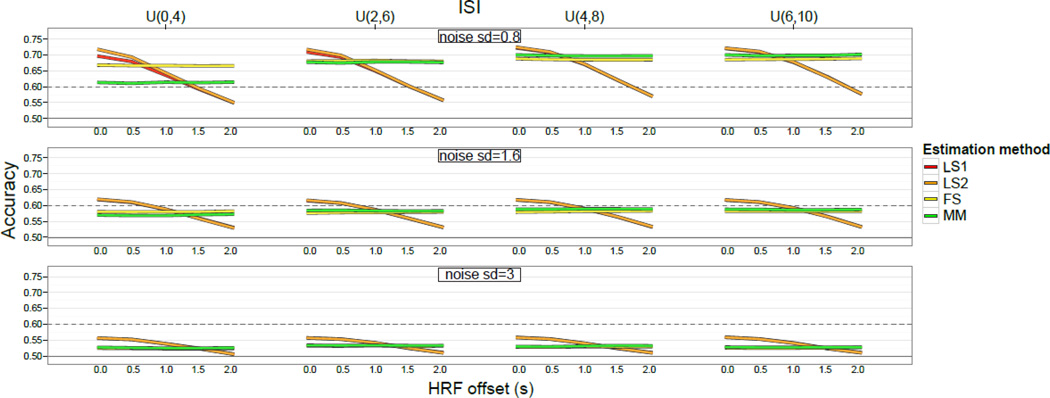
Figure 3.
Decrease in accuracy caused by using a shifted HRF to generate simulated data. Each line runs from 0 s shift to 2 s shift in steps of 0.5 s. The solid horizontal line indicates chance (50%), while the dashed line indicates accuracy significantly better than chance according to the binomial distribution.

