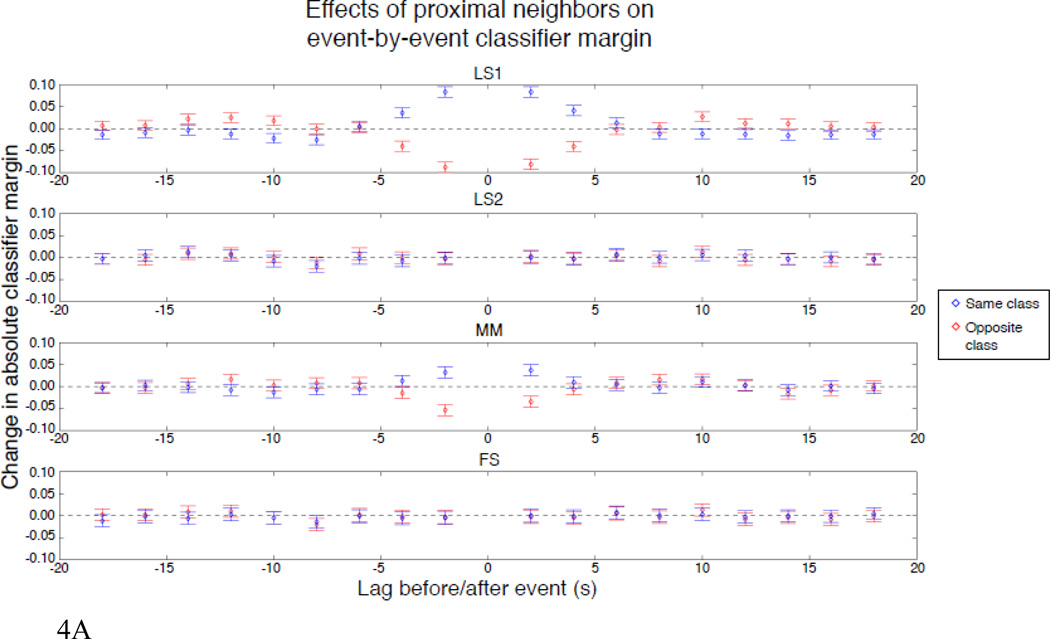
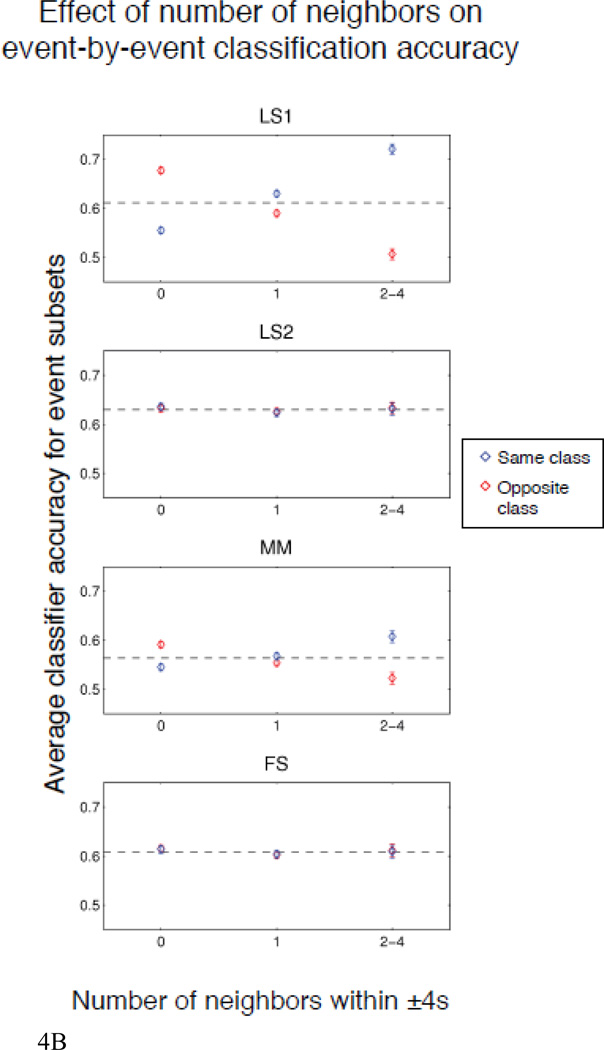
Figure 4.
a. Beta weights (±95% confidence intervals) showing the influence of neighboring events for 50 simulated runs with 0–4s ISI and noise standard deviation = 0.8. The ordinate shows change in classifier margin (y-axis of each frame) as a function of the presence of a neighbor at each 2s lag ±18s (x-axis), and whether that neighbor was of the same (blue) or opposite (red) class.
b. Average classifier accuracy (± 95% confidence interval) for each method as a function of number of same- or opposite-class neighbors within ±4s, for 50 simulated runs with 0–4s ISI and noise standard deviation = 0.8.


