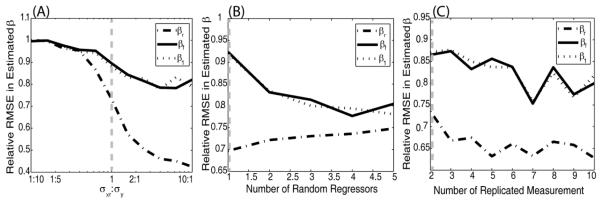
Figure 3.
The rRMSE of regression calibration to OLS for each estimated coefficient (βr,βf,β1) are plotted as a function of the ratio of the true standard deviations, σx,r:σy (A), the number of random regressors, (B), and the number of replicated measurements (C). (Note, y-axis was visually optimized for each figure and are not common across A, B, and C.) With increasing σx,r:σy ratios, regression calibration has increased relative accuracy in βr estimates compared to OLS. The common simulation shared in (A, B, C) is indicated by a gray line.

