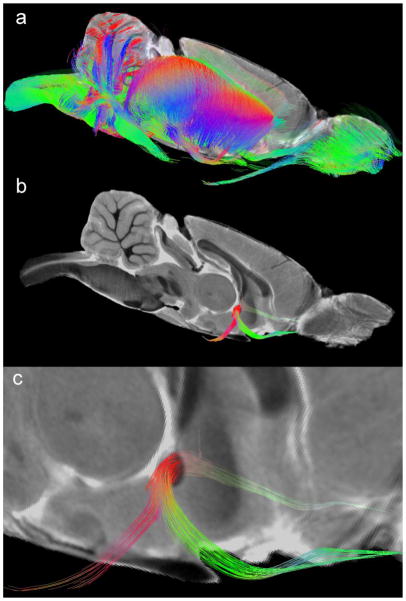
Figure 6.
DTI data can be used to extract fiber connectivity between regions. (a) Tractography volume of the whole brain showing 3% of the fibers detected. (b) Fiber tracts in specific structures (e.g., the anterior commissure) can be isolated. (c) Magnified view of the tractography data in the anterior commissure demonstrates the exquisite spatial resolution of these data.

