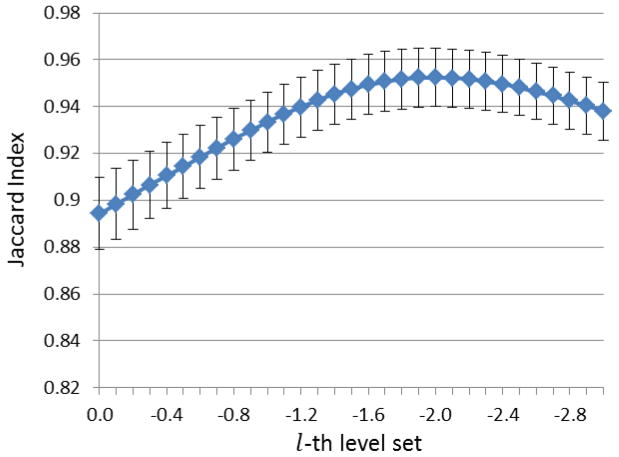
Figure 8.
Parameter selection for the level set approach on 24 subjects. X-axis is the selected value of level-set function, where negative value means level-set boundary includes more brain regions. Y-axis is the overlap rate between the ground-truth and the automated skull-stripping using the respective parameter. Vertical lines mean the standard deviation of the measurements.

