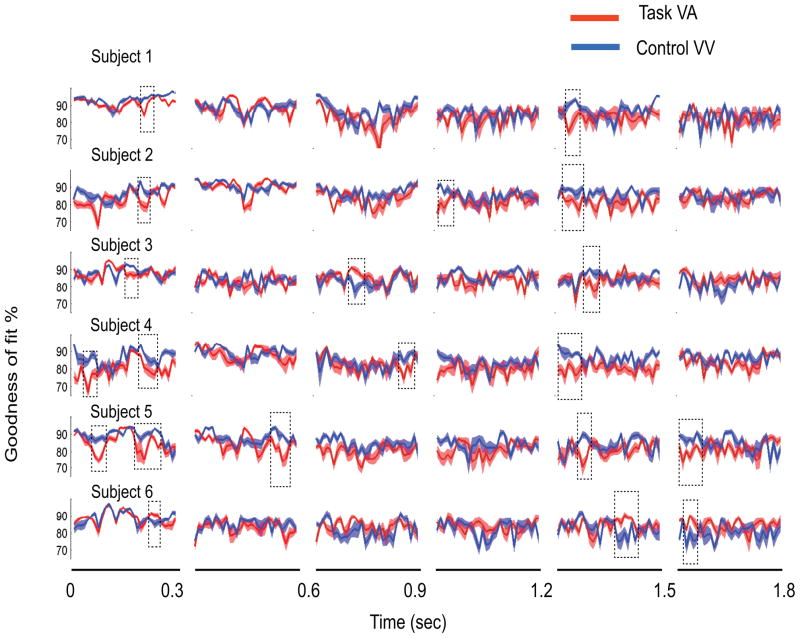
Figure 9.
For PCA variance threshold of 85%, the temporal evolution of the goodness of fit of reconstruction for VA and VV task conditions are plotted over 0.3 sec time windows (mean in dark solid lines and standard error of mean at 95% signifiance as shaded areas). The control subspace used in both cases are computed using PCA on the ERF of VV condition over the corresponding time window (see text for details). The divergent time interval spanned by the rectangular box indicates significant network divergence. The left and right edges of the box signify onset and offset times. In this particular example only one bootstrapped iteration of the analysis is displayed for each subject. We performed statistics on the network measures, onset and offset times and network divergence from many realizations

