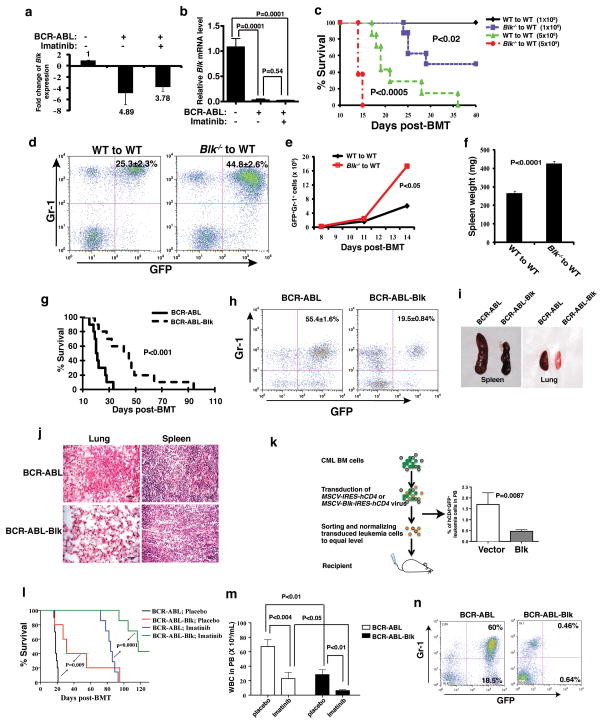
Figure 1. Blk suppresses CML induction by BCR-ABL.
(a) Microarray analysis Blk expression in LSCs of CML mice and upon imatinib treatment. Mean ± s.e.m. (b) Real-time RT-PCR analysis of Blk expression in LSCs of CML mice compared to GFP vector-transduced normal stem cells. Mean ± s.e.m. (c) Kaplan-Meier survival curves for recipients of BCR-ABL-transduced bone marrow cells from WT (n=7) or Blk−/− (n=8) donor mice. (d) The percentage of GFP+Gr-1+ cells in peripheral blood at day 11 after transplantation. (P<0.002). (e) Total number of GFP+Gr-1+ cells in peripheral blood at days 8, 11, 14 after transplantation. (P<0.05). (f) Spleen weight at day 11 after transplantation. Mean ± s.e.m. (g) Kaplan-Meier survival curves for recipients of BCR-ABL (n=10) or BCR-ABL-Blk (n=10) transduced bone marrow cells. (h) The percentage of GFP+Gr-1+ cells in peripheral blood at day 15 after transplantation. (P<0.001). (i) Gross appearance of the lungs and spleens at day 15 after transplantation. (j) Photomicrographs of haematoxylin and eosin-stained lung and spleen sections (Scale bar = 100μm). (k) Leukemia cell growth in recipients transplanted with equal numbers of GFP+hCD4+ cells. Mean ± s.e.m. (l) Kaplan-Meier survival curves for recipients of BCR-ABL (n=7) or BCR-ABL-Blk (n=7) transduced bone marrow cells treated with a placebo or imatinib (P=0.0001). (m) Total number of white blood cells in peripheral blood at 1 week after the treatment with a placebo or imatinib. Results are given as mean ± s.e.m. (n) FACS analysis showing the percentage of GFP+ leukemia cells at 8 weeks after imatinib treatment.

