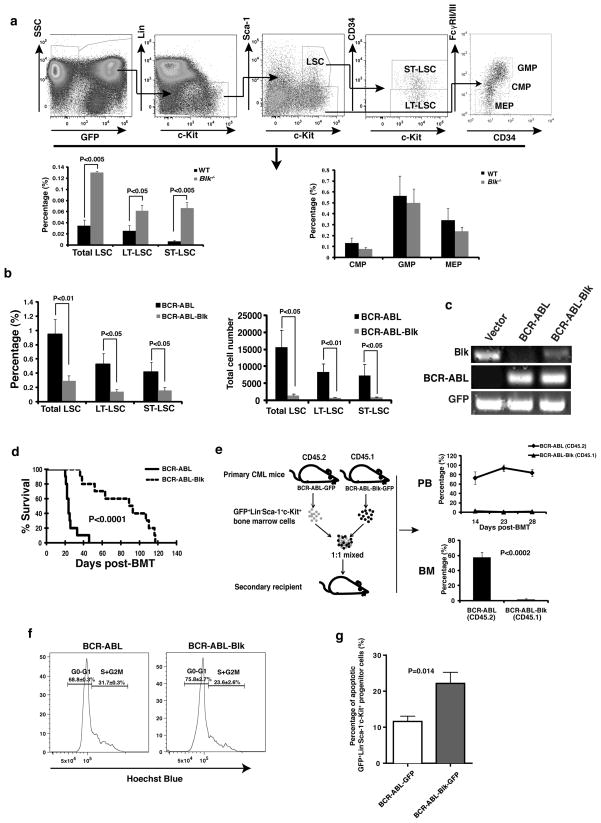
Figure 2. Blk suppresses LSCs.
(a) The percentages of total LSCs, LT-LSCs, ST-LSCs, CMP, GMP and MEP in bone marrow of recipients of BCR-ABL-transduced Blk−/− donor bone marrow cells (n=9) were compared with those in bone marrow of recipients of BCR-ABL-transduced WT donor bone marrow cells (n=5) at day 11 after transplantation. Mean values ± s.e.m. (b) The percentages and numbers of total LSCs, LT-LSCs and ST-LSCs in bone marrow of recipients of BCR-ABL- or BCR-ABL-Blk-transduced bone marrow cells were analyzed at day 15 after transplantation. Mean values ± s.e.m. (n=5). (c) RT-PCR analysis of expression of Blk, BCR-ABL, and GFP in FACS-sorted LSCs at 2 weeks after transplantation. (d) Kaplan-Meier survival curves for secondary CML mice receiving bone marrow cells obtained at day 15 after transplantation from primary CML mice induced by BCR-ABL or BCR-ABL-Blk (n=10 for each group). (e) 103 sorted-LSCs from bone marrow of primary CML mice induced by BCR-ABL-transduced CD45.2 or BCR-ABL-Blk-transduced CD45.1 donor bone marrow cells were mixed at 1:1 ratio, followed by transplantation into recipient mice. The percentages of BCR-ABL- and BCR-ABL-Blk expressing cells in peripheral blood and bone marrow were compared at 2, 3, and 4 weeks after transplantation (n=3 for each time point). (f) Cell cycle analysis of LSCs from bone marrow of CML mice induced by BCR-ABL or BCR-ABL-Blk (n=5 for each group). (P<0.05). (g) The percentage of apoptotic GFP+Lin−Sca-1+c-Kit+ cells in bone marrow from CML mice at day 14 after transplantation. Mean values ± s.e.m.

