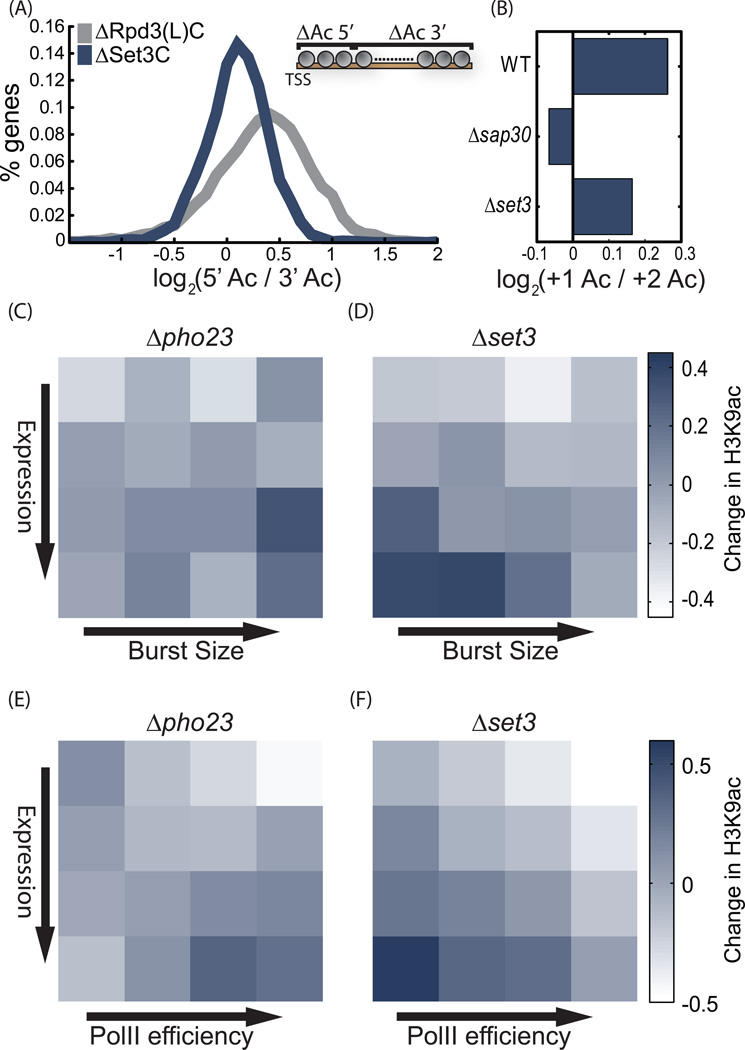
Figure 5. Gene targets of Rpd3(L)C and Set3C.
A. Activities of Set3C and Rpd3(L)C along the coding region: For each mutant, the ratio between the (log2) change in H3K9ac at gene beginning (TSS to TSS+400bp) and at gene end (TSS+400 to gene end) was measured. Shown is the histogram of this ratio, averaged for two mutants of each complex (SAP30, PHO23 for Rpd3(L)C and HOS2, SET3 for Set3C).
B. The decrease in H3K9ac at the +2 vs. +1 nucleosomes depends on Rpd3(L)C: the (Log2) ratio between H3K9ac levels at the +1 vs. the +2 nucleosomes in the indicated mutants.
C–F. Burst size and PolII efficiency of target genes: Genes were ordered into 16 groups based on gene expression and burst size (or PolII efficiency, as indicated). Shown is the average change in H3K9ac for each group and indicated mutant. For burst size, the analysis was restricted to the ~2000 genes where data is available, while PolII efficiency was defined for all genes. In each mutant, changes in H3K9ac were normalized to a mean of 0 and standard deviation of 1, to allow easier comparisons.
See also figure S4

