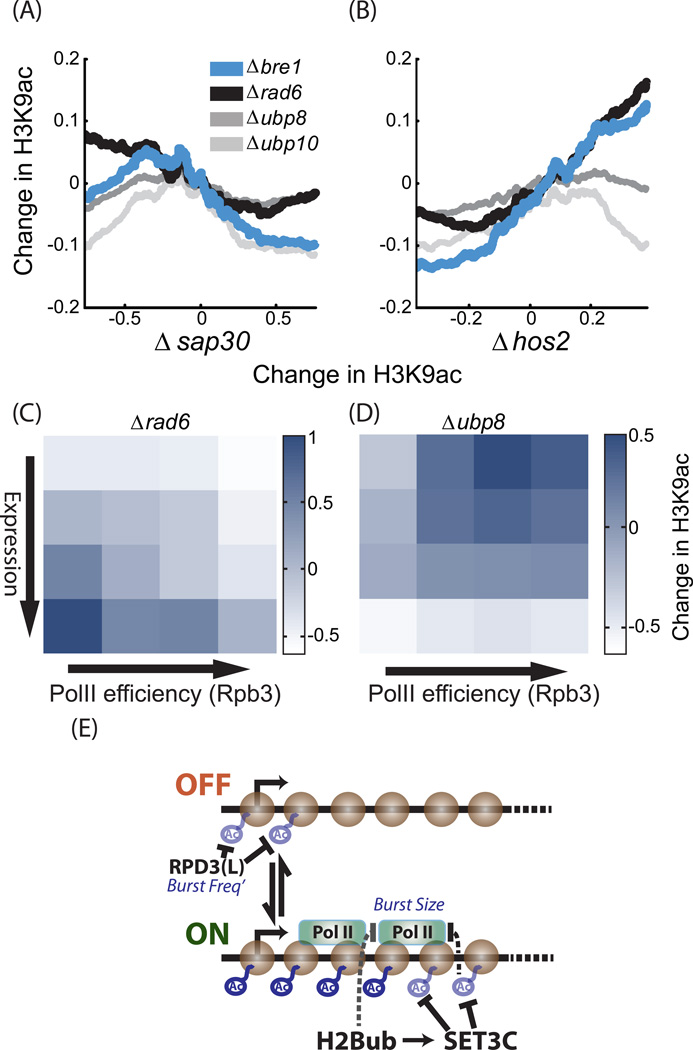
Figure 7. H3K9ac profiles in mutants deleted of ubiquitination and de-ubiquitination enzymes.
A–B. Deletion of BRE1 or RAD6 increase acetylation of Set3-dependent genes: Genes were sorted by average change in H3K9ac in strains deleted of SAP30 (A) or HOS2(B). The (log2) change in acetylation in the indicated mutants is shown. H3K9ac values were averaged over 400 genes sliding window.
C–D. BRE1 targets genes of high Expression and low PolII efficiency: genes were ordered into 16 groups based on gene expression and PolII efficiency. Shown is the average change in H3K9ac at the indicated mutant for each group. In each mutant, changes in H3K9ac were normalized to a mean of 0 and standard deviation of 1, to allow an easier comparison (See also figure S6G–J for other mutants).
E. Graphic model summarizing the results: In the prevailing model of gene expression, genes are made in bursts, namely period of extensive expression interspaced by time intervals in which expression is negligible. This is captured by assuming that gene can be at two states: a state permissive for expression (ON) and a state that is not permissive (OFF). The rate of transition from the OFF to ON state defines the burst frequency, while the number of proteins made per burst even defines the burst size. Gene expression can be regulated through changes in either burst frequency or burst size. Our results indicated that Rpd3(L) represses burst frequency, probably by deacetylation of nucleosomes at the beginning of a gene (+2 in particular). In contrast, Set3C and ubH2B are predicted to repress burst size by reducing PolII processivity. ubH2B and Set3C likely function within the same pathway, to modulate nucleosomes within the gene.
See also figure S6

