
Figure 7.
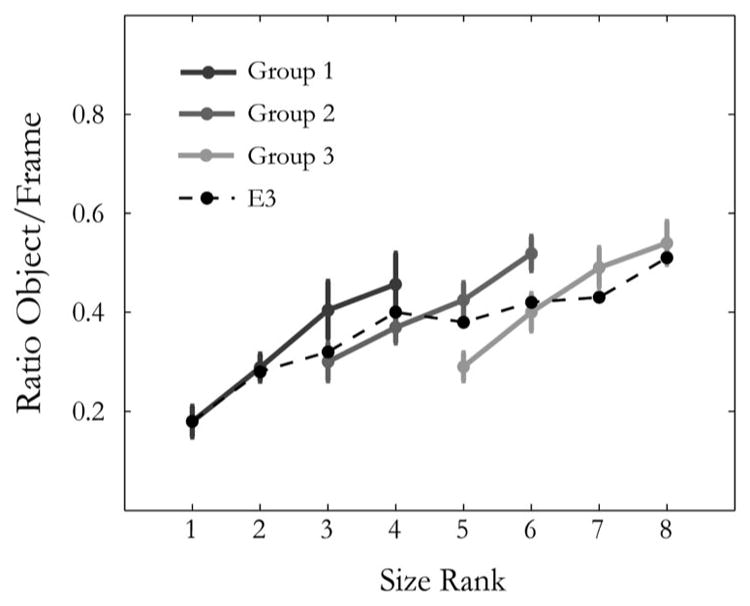
Results of size range experiment. The average preferred size of objects for the three groups of observers, expressed as a ratio between the size of the object and the size of the screen, is plotted for each group as a function of the size rank of the objects. Dashed line indicates the preferred sizes from Experiment 3. Error bars represent ± 1 SEM.