
Figure 8.
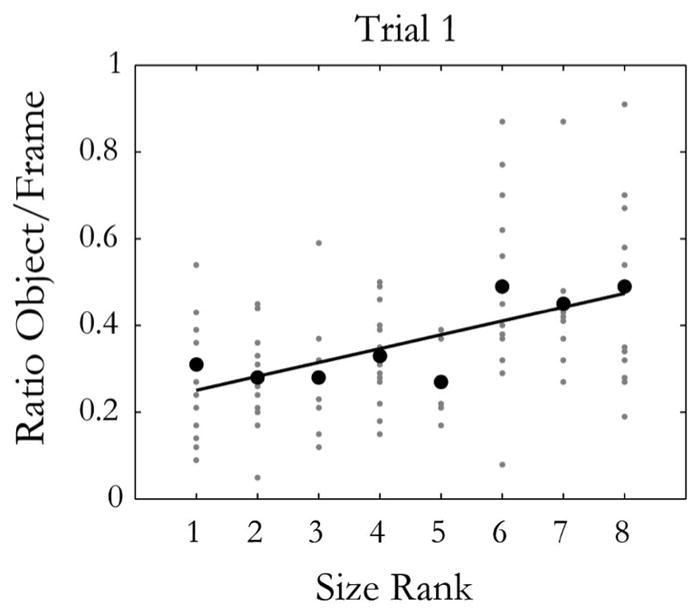
Trial 1 Analysis. Average drawn, imagined, or preferred visual size for the first trial only of all Experiments 1–5. These visual sizes are expressed as a ratio between the size of the object and the size of the frame, plotted as a function of the size rank of the objects. Each gray point represents a participant, with the average visual size per size rank shown in black points.