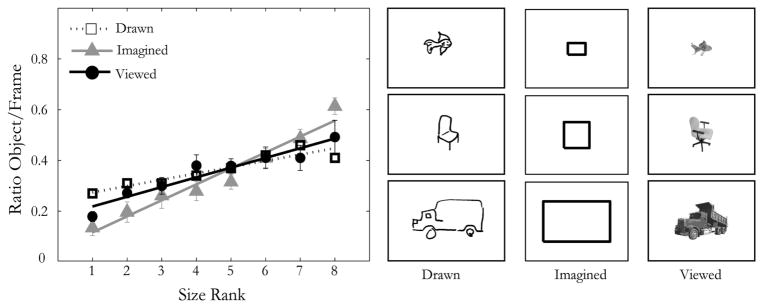
Figure 9.
Left: Results of Experiments 1 (Drawn), 2 (Imagined), and 3 (Viewed), overlaid on one graph. The x-axis shows the size rank of the object; the y-axis shows the diagonal ratio of the object in the frame. Error bars represent ± 1 SEM. Right: Example drawings of a fish, chair, and dump truck for a single observer. The average imagined size and preferred size across observers are shown for these same objects in the adjacent columns. Note that separate groups of observers participated in the Drawn, Imagined, and Viewed experiments.

