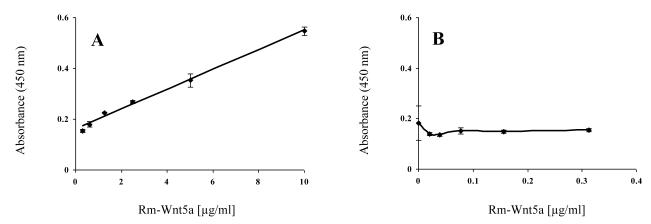
Figure 8.
Titration curve of the sandwich ELISA. The sandwich ELISA, using biotinylated goat anti-mouse Wnt5a and HRP-streptavidin detection system, was used to detect different concentrations of rm-Wnt5a (0 to 10 μg/ml). The absorbance was measured after 2 hrs of the enzyme-substrate reaction. The measured absorbance was plotted against rm-Wnt5a concentration from 0 .3125 to 10 μg/ml (A) and 0 to 0.3125

