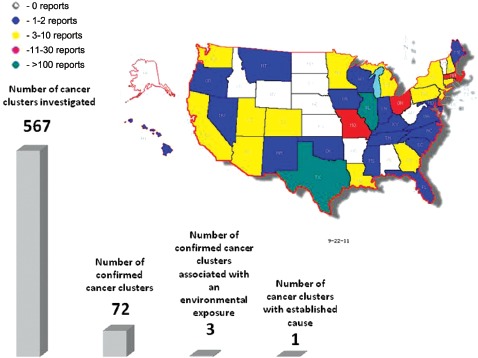
Figure 1.

Numbers of publicly available cancer cluster investigation reports by state and comparison of numbers of investigated cancer clusters, confirmed cancer clusters (e.g. investigated clusters where number of cancer cases is greater than expected), clusters linked to an environmental exposure, and cancer clusters with an established cause. Although some of the cluster investigations may have been described in several reports, the numbers in this figure represent unique reported clusters. (Map generated from data in Table 1 using Map-Maker Utility, http://monarch.tamu.edu/∼maps2/us_12.htm)
