
Fig. 2.
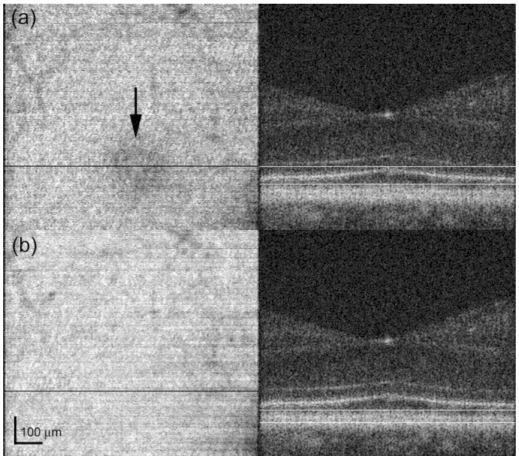
En-face OCT images at the photoreceptor layers (left) and corresponding summed layers shown in cross-sectional image through the fovea (right). (a) Composite image created from 27 depth slices through the IS/OS junction layer. Decreased reflectivity within 0.5 deg of the fovea is clearly visible (arrow). (b) Composite image created from 15 depth slices through the posterior tips of the OS.