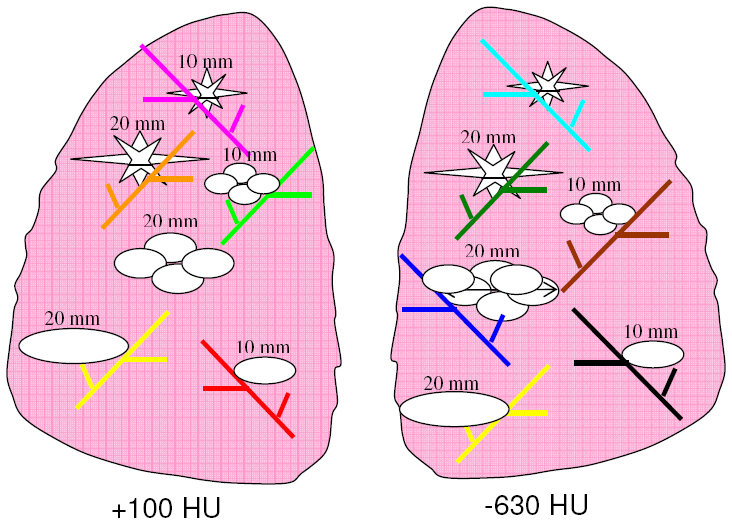
Fig. 3.

An example layout (Layout #4) indicating the positioning of each nodule along with information on the size, shape, and density of each nodule in the layout. Vessel branches within the anthropomorphic phantom were color coded in order to map nodules to specific positions within the phantom’s vasculature structure in a reproducible manner. Nodule sizes in the figure correspond to equivalent diameters of spheres with the same nominal volume as the nodule.
