
Fig. 4.
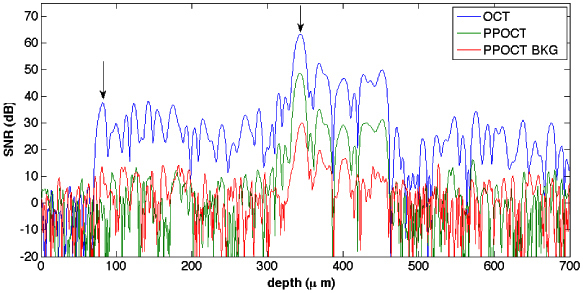
OCT (blue), PPOCT (green) and PPOCT background (red) A-lines on an SNR dB scale. The A-lines were taken from the 319 μm B-scans. The PPOCT background corresponds to the pump off image.
Official websites use .gov
A
.gov website belongs to an official
government organization in the United States.
Secure .gov websites use HTTPS
A lock (
) or https:// means you've safely
connected to the .gov website. Share sensitive
information only on official, secure websites.
OCT (blue), PPOCT (green) and PPOCT background (red) A-lines on an SNR dB scale. The A-lines were taken from the 319 μm B-scans. The PPOCT background corresponds to the pump off image.