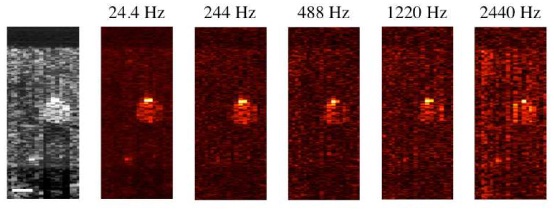
Fig. 5.

OCT (grayscale) and PPOCT B-scans of a human hair embedded in chicken breast, recorded at different PPOCT line rates. In all cases the OCT line rate was 12.2 kHz, hence 24.4 Hz corresponds to 500 OCT lines/ PPOCT line. The scale bar is 100 μm. All images are on a log intensity scale.
