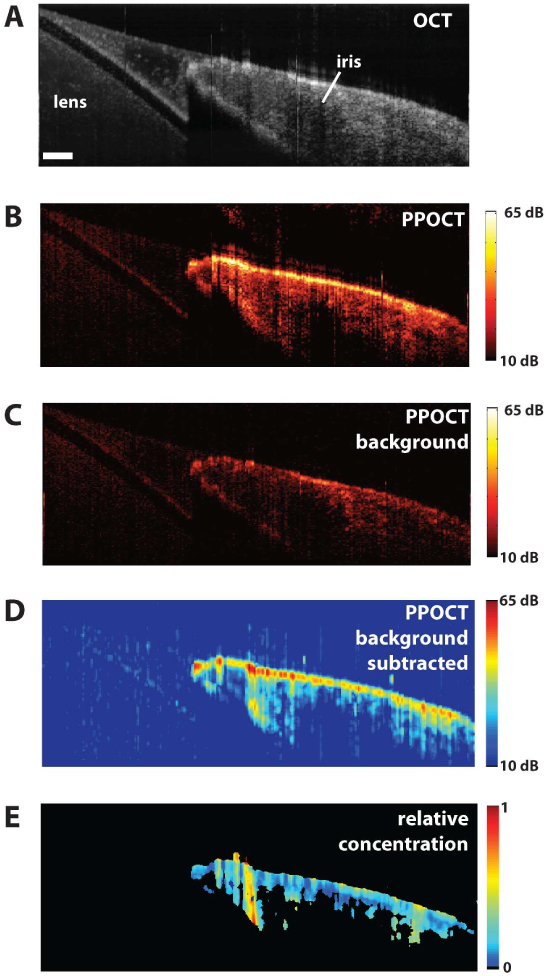
Fig. 8.

A) OCT image of the porcine lens and iris. The scale bar is 200 μm. B) PPOCT image mapping the melanin in the iris. The color bar is in dB SNR. C) PPOCT background image recorded without the pump radiation. The color bar is in dB SNR. D) Background subtracted PPOCT image derived from spatially averaged version of B and C. The color bar is in dB SNR. E) Reflectivity independent molecular image on a linear scale where 1 indicates the maximum concentration. All images except E are on a log scale.
