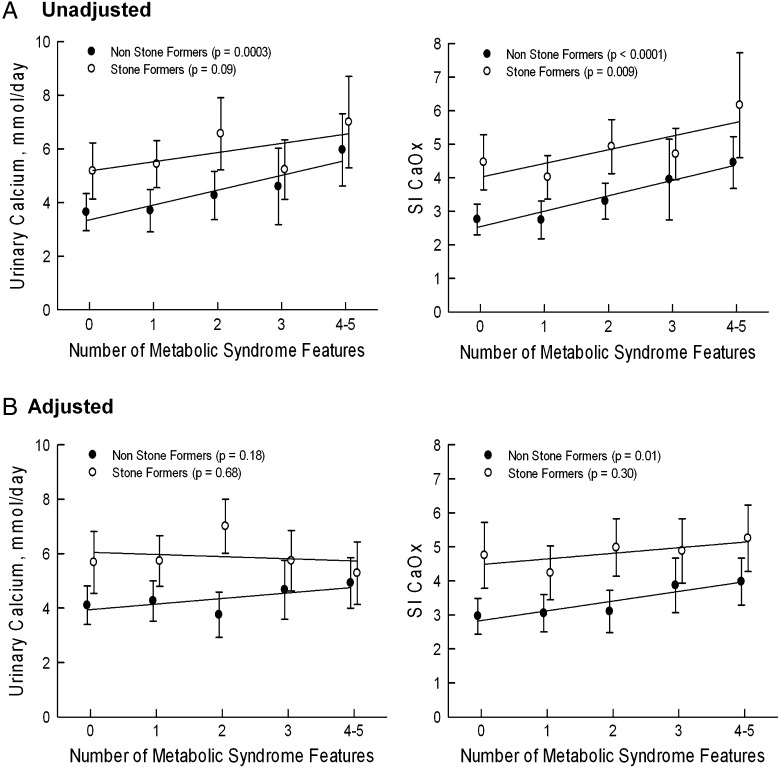
Fig. 1.
Trends in urinary calcium and Supersaturation index of calcium oxalate (CaOx). (A) Unadjusted. (B) Adjusted for total volume, age, gender, urine sodium and urine sulfate. Data are presented as mean and 95 % confidence interval. P-values represent tests of linear trends for each group. Unadjusted and adjusted urinary calcium and SI CaOx values were higher in stone formers than in non-stone formers at across of features of the MS (P ≤ 0.001).

