
Fig. 1.
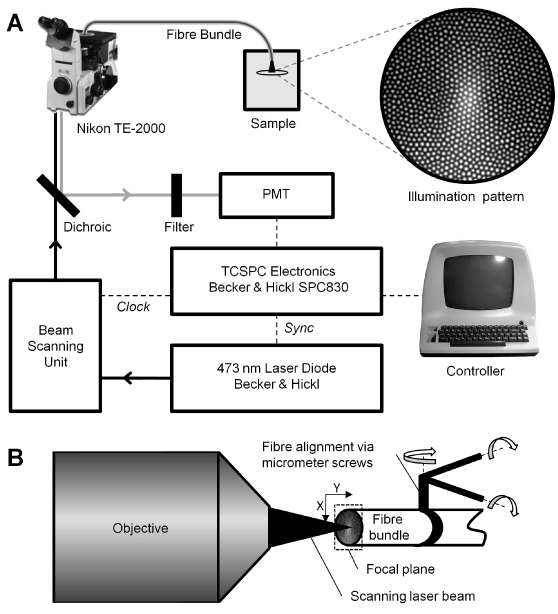
Schematic drawing of the experimental setup. (A) Main components of the setup are shown including a magnified reflection image of the front of the fiber bundle. The fiber cores have a diameter of 2.28 ± 0.48 µm and are spaced 2.80 ± 0.21 µm apart, leading to an optical resolution of about 5 µm. (B) Illustration of how the fiber bundle is coupled to the objective. The laser beam is scanned over the polished fiber bundle, which is aligned precisely with the focal plane.