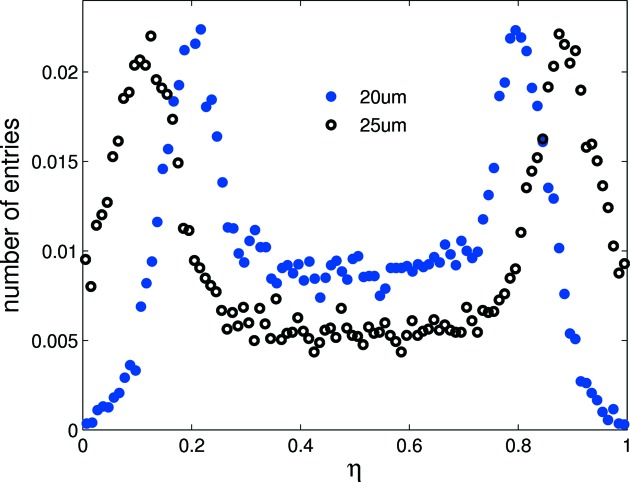
Figure 5.
Simulated η distribution of the 20 and 25 µm pitches for a coupling of K = 0.06 and ENC = 390 e− reconstructed from a flat-field distribution. Compared with the 25 µm pitch, the peaks of the 20 µm-pitch η distribution exhibit a significant shift towards the centre of the η distribution and a higher plateau at the centre, indicating a greater degree of charge sharing.

