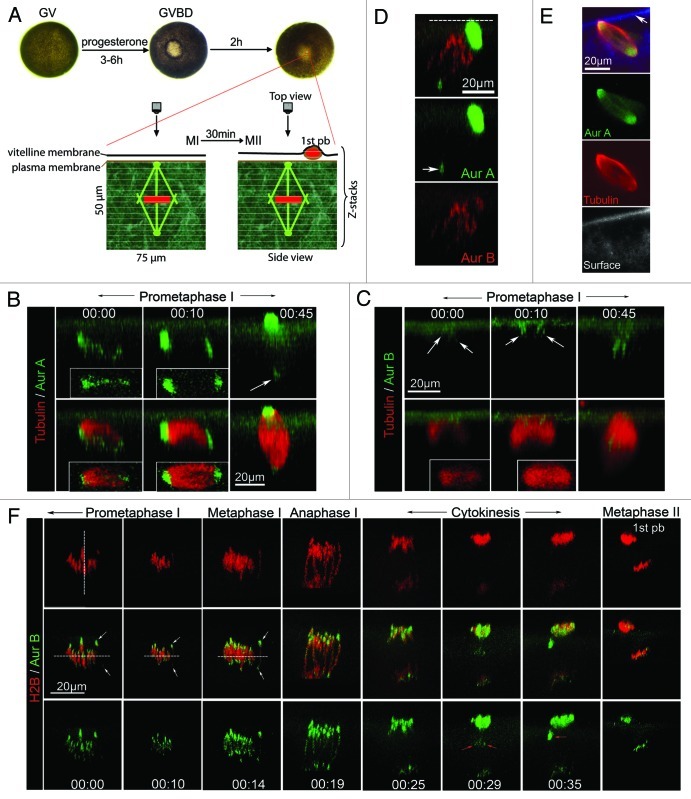
Figure 1. Dynamic localization of Aur-A and Aur-B during polar body emission. (A) Live cell imaging during frog oocyte maturation: Prophase (aka germinal vesicle or GV) oocytes were injected with fluorescence probes and stimulated with progesterone to initiate oocyte maturation. Individual ocoytes were picked at GVBD and further incubated for various time (30–110 min) prior to the start of image acquisition by laser scanning confocal microscopy, focusing on a small square (typically 75 μm) centered around the “translucent spot” (visible ~1 h following GVBD, corresponding to spindle pole anchoring site). The Z stacks are volume-rendered into 3D representations. Most images in this paper are 3D images in the transverse direction (side view) with plasma membrane on top, unless otherwise indicated. (B) Aur-A signal transformed from multi-foci to bipolar: Side view of time series (00:00, indicating the start of image collection in hh:mm) of a representative oocyte injected with Alexa488-anti-Aur-A and rhodamin-tubulin-β. Images were acquired with a Z step of 3 μm. Insets show the respective top views. Arrow denotes cytoplasmic pole, which appeared much dimmer than the cortical pole due to its depth (30–40 μm) in the cytoplasm. (C) Aur-B associated with microtubules before spindle became bipolar: Time series (side view) of a representative oocyte injected with Alexa488-anti-Aur-B and rhodamin-tubulin-β. Images were acquired with a Z step of 2 μm. Insets show the respective top views. Arrows denote Aur-B signal. (D) Specificities of Aur-A and Aur-B probes: A representative oocyte injected with Alexa488-anti-Aur-A and Alexa594-anti-Aur-B, depicting the distinct localization of the two Aurora kinases. Only one time point (60 min after GVBD) is shown. Dashed line indicates plasma membrane. Arrow denotes cytoplasmic Aur-A (pole). (E) Spindle image of fixed and bisected oocyte: Uninjected oocytes were fixed 70 min after GVBD and bisected through the small translucent dot (spindle anchoring site) (Fig. 1A). The bisected oocytes were stained with anti-Aur-A and anti-α-tubulin. Single plane confocal images are presented, depicting relatively symmetric distribution of endogenous Aur-A and microtubles along the spindle axis. While Aur-A and tubulin signals are from the same focal plane, the bottom panel represents background fluorescence at a nearby focal plane (the bisection surface), depicting plasma membrane (arrow). (F) Aur-B was most prominently centromeric in metaphase I: Time series (side view) of a representative oocyte injected with RFP-H2B mRNA and Alexa488 anti-Aur-B. Images were acquired at Z step of 0.5 μm and XY pixel of 0.08 x 0.08 μm. Vertical dashed line denotes spindle axis. White arrows denote the two Aur-B domains (centromeres) of the same bivalent, which was used to place the proposed metaphase I plane (horizontal dashed lines). Red arrows denote central spindles (00:29) and midbody (00:35). The last image (metaphase II, 3h after GVBD) was from a different oocyte imaged in the same experiments.

An official website of the United States government
Here's how you know
Official websites use .gov
A
.gov website belongs to an official
government organization in the United States.
Secure .gov websites use HTTPS
A lock (
) or https:// means you've safely
connected to the .gov website. Share sensitive
information only on official, secure websites.
