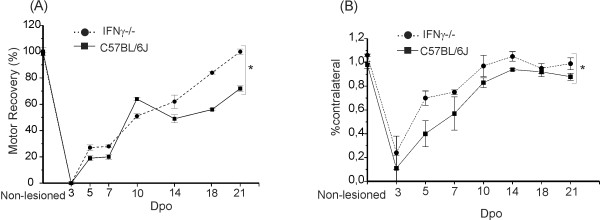
Figure 8.
(A) Graph of the sciatic functional index (SFI) values according to the group and time of evaluation. The data are presented as the percentage of the preoperative values. (B) The intensity of the paw print is shown as a percentage of the contralateral paw during 21 days post-operative (Dpo).

