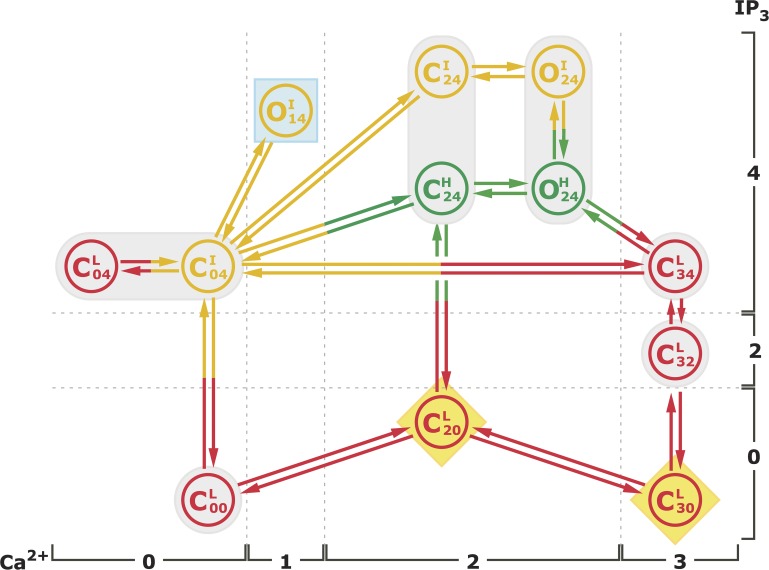
Figure 1.
The kinetic scheme for the proposed model. The superscript of each state denotes the gating mode that state is in. The two numbers in the subscripts indicate the number of Ca2+ and IP3, respectively, that is bound to the channel in that state. The model has nine closed states (, , , , , , , , and ) and three open states (, , and ). The elliptical shadings highlight complexes needed to account for the ligand dependencies of the channel Po. The square shading highlights the complex required to fit the modal gating statistics, and the diamond shadings highlight complexes introduced as a result of IP3 activation latency distribution. The transition rates between various states and the related flux parameters are listed in Tables S2 and S3, respectively.

