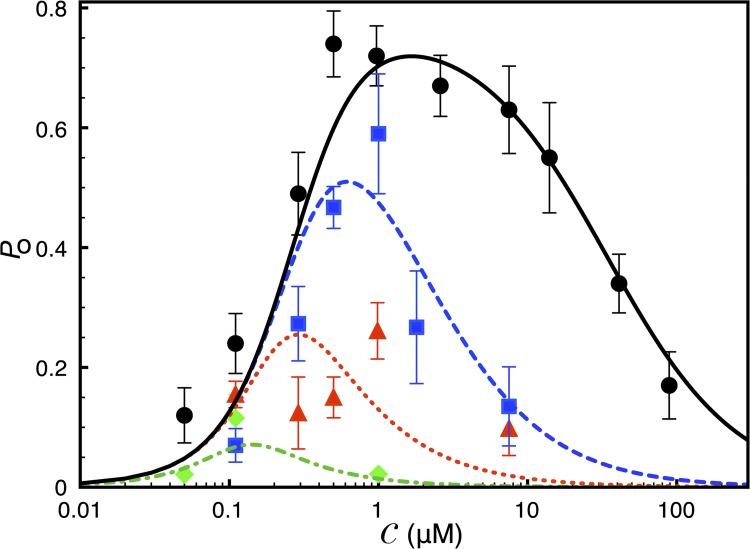
Figure 2.
Ca2+ dependence of IP3R channel Po. Channel Po under IP3 concentration of 10 µM (bullets and solid line), 100 nM (squares and dashed line), 33 nM (triangles and dotted line), and 10 nM (diamonds and dotted-dashed line). The symbols represent mean experimental Po, error bars represent standard errors of the mean, and lines are theoretical fits. The experimental data are taken from Ionescu et al. (2006) (supplemental text, section 1.10.1).

