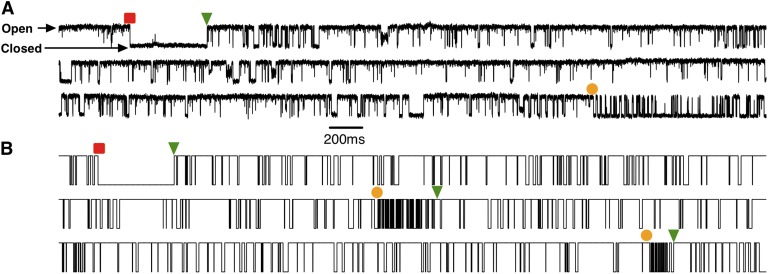
Figure 3.
Modal gating time series. (A) Single-channel current record of IP3R channel gating in the presence of  = 1 µM and
  = 10 µM. (B) Simulated binary on/off single-channel current record generated from the model. The squares, bullets, and triangles indicate a transition to the L, I, and H gating mode, respectively.

