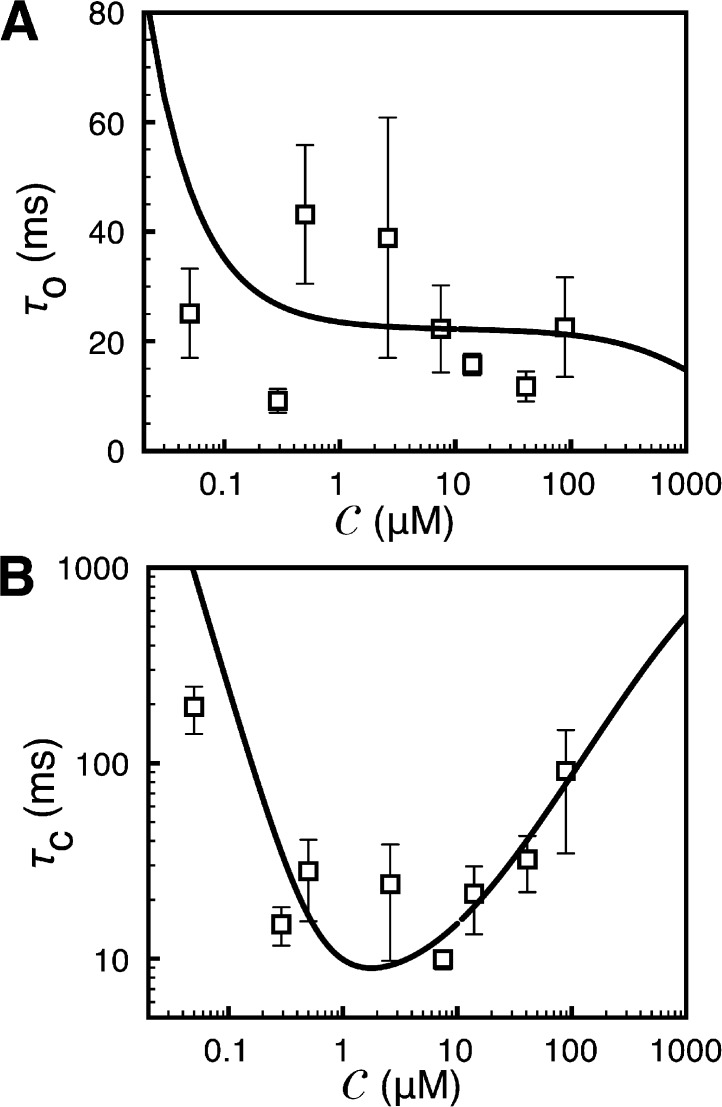
Figure 6.
Ca2+ dependence of IP3R channel mean open and closed times. Mean open (A) and closed times (B) for fixed  = 10 µM. The solid curves are theoretical fits, and squares are experimental values. The experimental data are taken from Ionescu et al. (2006) (supplemental text, section 1.10.1).

