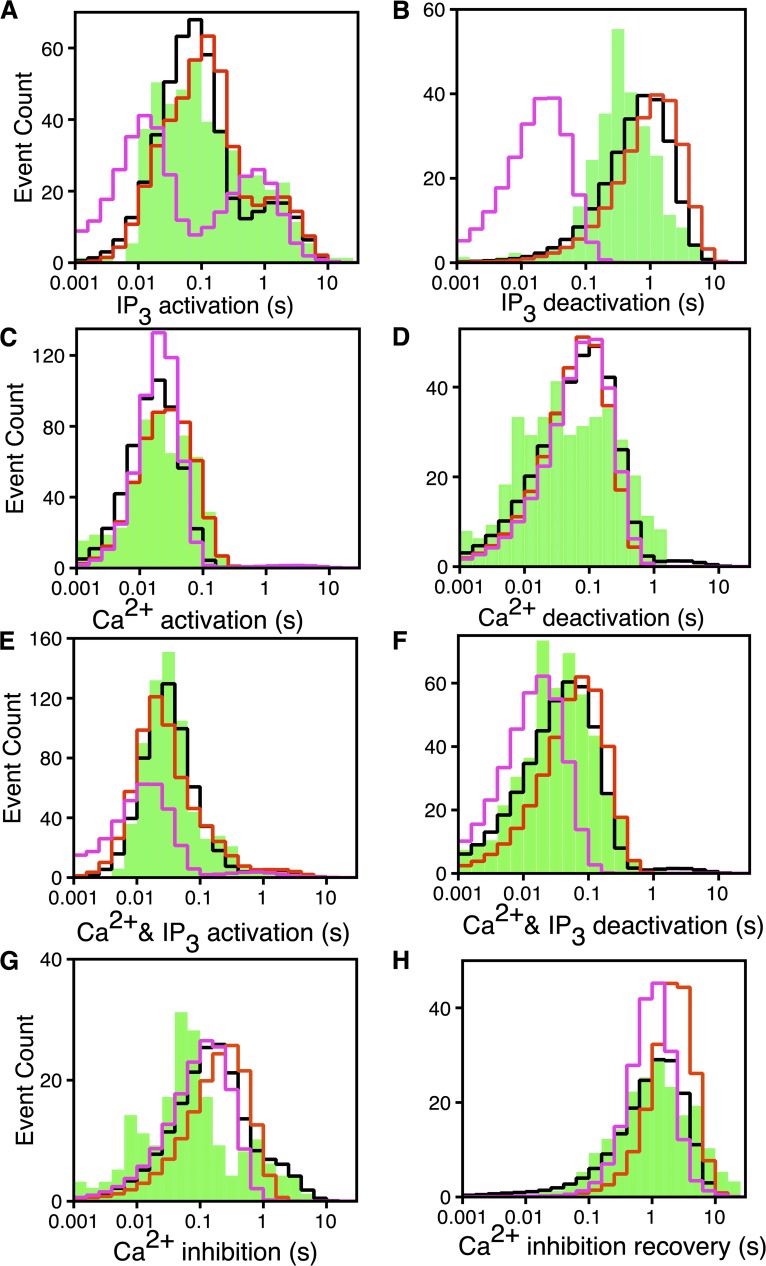
Figure 9.
Fits from the DYKM. Logarithmically binned latency histograms of IP3R channels responding to changes in  and
and  . In each case, (
 ,
,  ) are changed as indicated in Fig. 5. (A) IP3 activation, (B) IP3 deactivation, (C) Ca2+ activation, (D) Ca2+ deactivation, (E) Ca2+ and IP3 activation, (F) Ca2+ and IP3 deactivation, (G) Ca2+ inhibition, and (H) Ca2+ inhibition recovery. The experimental latency distributions given by the bars are taken from Mak et al. (2007). The red and pink lines, respectively, are from the DYKM when fit to the latency data alone and latency and times-series data simultaneously. The black line is from the CM developed in this paper when fit to the latency and times-series data simultaneously and is shown for comparison.

