Figure 1.
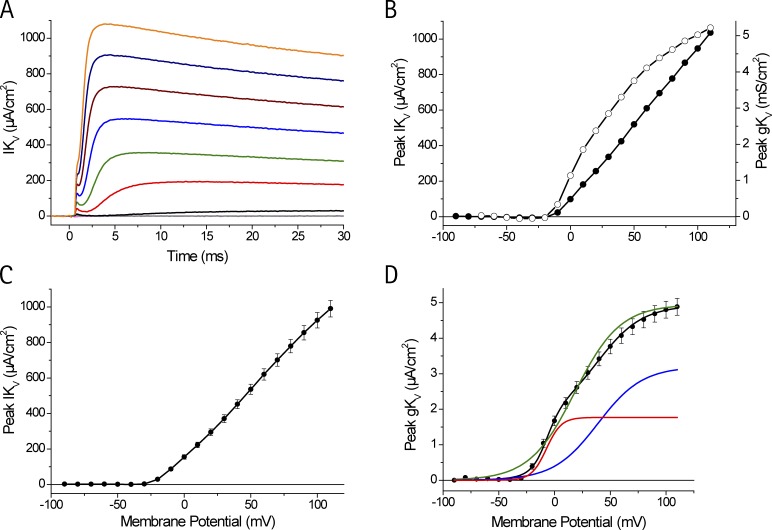
Delayed rectifier K currents in FDB fibers. (A) IKV recorded in response to depolarizations from VH to membrane potential values ranging from −30 to 110 mV in 20-mV steps (gray to orange traces). The NMG-Tyrode contained no Ca2+ channel blockers. Linear leak and capacitances were removed from each raw current record by subtracting a scaled version of the current record obtained in response to a 50-mV pulse. (B) Voltage dependence of the peak IKV (closed circles) and peak gKV (open circles). For both plots, the circles are connected with straight lines. (C) Voltage dependence of the mean peak IKV obtained from 16 voltage families in 14 different fibers. (D) Voltage dependence of the mean peak gKV (circles), calculated from the data in C. The green trace is a single Boltzmann fit to the data with the following parameters (mean ± SD): A = 4.77 ± 0.9 mS/cm2; V1 = 18.2 ± 6.3 mV; K1 = 20.4 ± 1.5 mV. The black trace is a double Boltzmann fit to the data with the following parameters: A = 4.93 ± 0.9 mS/cm2; ε = 0.36 ± 0.06; V1 = −7 ± 4.7 mV; K1 = 6.7 ± 1.1 mV; V2 = 39 ± 6.6 mV; K2 = 19.9 ± 2.3 mV. The red and blue traces are the independent components of the double Boltzmann function. Error bars represent SEM.

