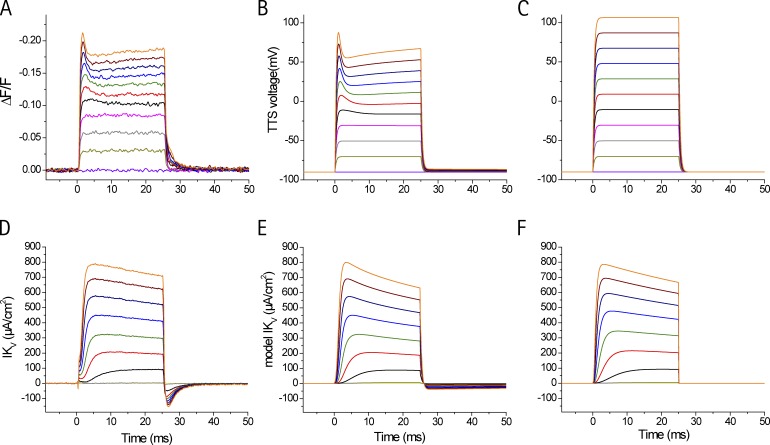
Figure 8.
Radial cable predictions of IKV and TTS membrane potential changes in intact fibers using multistate models of K channels. (A) di-8-ANEPPS transients recorded in the presence of NMG-Tyrode. The fiber was depolarized in 20-mV steps from −90 (VH) to 110 mV. (B) Model predictions of the mean TTS voltage (see Appendix) for the same conditions as in A, and assuming the same value of gKV for the sarcolemma and TTS membranes (0.97 mS/cm2). The model parameters for channels A and B are those in Table A1 of the Appendix. (C) Model predictions of the mean TTS voltage, assuming that gKV (3.88 mS/cm2) is located exclusively at the surface membrane. (D) IKV recorded simultaneously with the optical data in A. (E and F) The predicted currents corresponding to the optical simulations in B and C are shown in E and F, respectively. The same color code is used for electrical and optical data.

