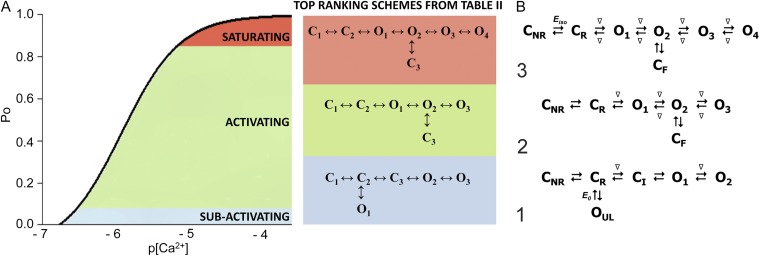
Figure 4.
Kinetic schemes to describe hRyR2 gating behavior during activation by [Ca2+]cyt. (A) The three stages of activation of RyR2, namely, the sub-activation, activation, and near saturation/saturation phases designated along a sigmoidal dose–response curve as light blue, green, and red, respectively. The top-ranking kinetic schemes (from Table 2) that best describe the gating behavior of the channel at those corresponding stages of activation are shown in the colored panels. (B) A mechanistic perspective to the various closed and open states as interpreted from the results (schemes 1, 2, and 3). Here, CNR and CR are the Ca2+ nonresponsive and responsive closed states, respectively, whereas CF is the flicker closing state from Ca2+-bound open states O1, O2, O3, and O4, etc. The unliganded open state is represented by OUL, whereas the subscripts 1, 2, 3, 4, etc., depict open states of the channel with increasing amounts of Ca2+ bound, although it should be noted that the numbers in the subscript do not in any way refer to the actual number of Ca2+ ions bound to the channel. The [Ca2+]cyt-dependent transitions are labeled by < above and below the arrows. Eiso is the equilibrium constant of the transition between CNR and CR, whereas E0 is that for constitutive channel activation.

