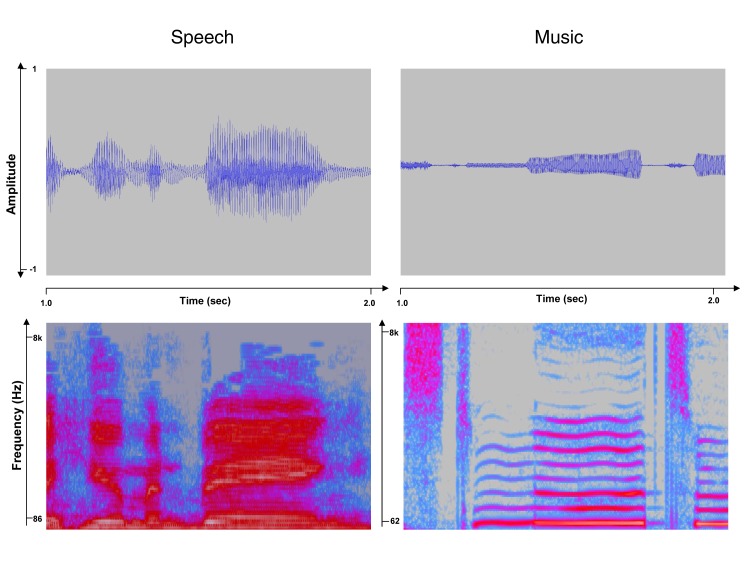
Figure 1. Acoustical representations of speech and song.
The top panels show the waveforms (amplitude as a function of time) of 2-s excerpts of samples of spoken and sung speech, respectively. The bottom panels show spectrograms (frequency as a function of time) of the same sound samples; intensity is coded by a color scale in this representation. Note the prominent fundamental frequency and harmonics (horizontal lines) present in the sung speech.

