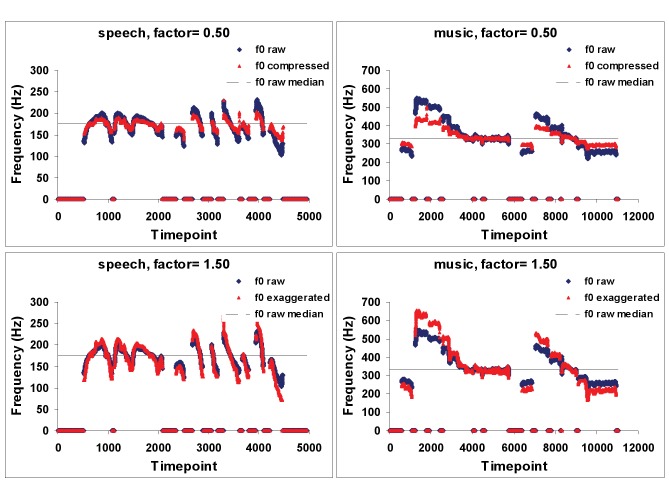
Figure 2. Each panel represents the fundamental frequency (F0) contour of a spoken utterance (left side of figure) or of sung speech (right side of figure).
Note the more continuous F0 contours for speech compared to the more discrete contours for song. The blue traces are the original contours, while the red ones represent distortions in which the F0 was either compressed by 50% (top panels) or exaggerated by 50% (bottom panels). The associated sound files illustrate that the manipulation of F0 on the speech sample (Sounds S1, S2, S3) has little perceptual effect, since it continues to sound natural (in fact, the change is hardly detectable). In contrast, the same degree of F0 distortion on the music (Sounds S4, S5, S6) is readily noticeable, as the familiar melody sounds obviously out of tune.

