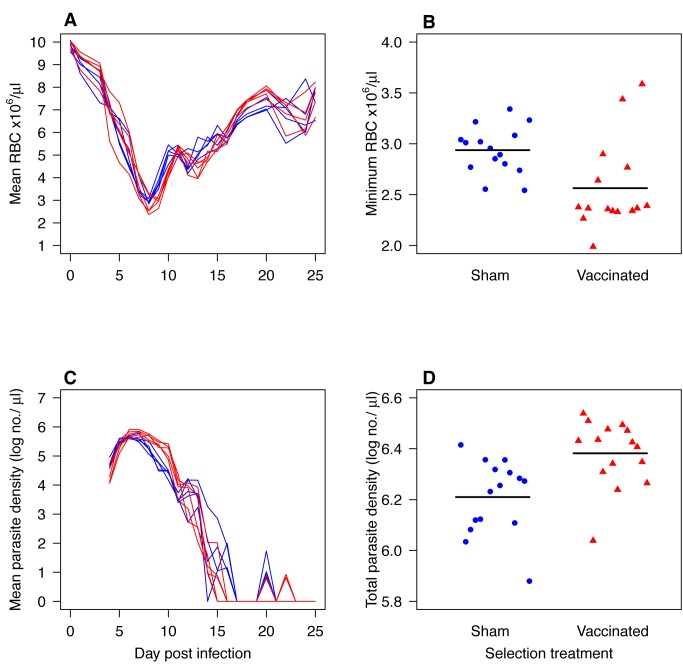
Figure 2. Virulence and densities in naïve mice of parasites that had previously been serially passaged 10 times through mice that were sham-vaccinated or AMA-1 vaccinated (“evaluation experiment 2”).
Curves (A and C) show the kinetics of five C-lines (blue) and five V-lines (red) each assayed in up to three mice. Points on the scatterplots (B and D) are individual mice infected with C-lines (filled blue circles) or V-lines (filled red triangles). Horizontal black lines indicate mean values. V-lines induced more anemia (A–B; F 1,28 = 8.4, p = 0.007) and reached higher total parasite densities than their comparator C-lines (C–D; F 1,28 = 11.5, p = 0.002).

