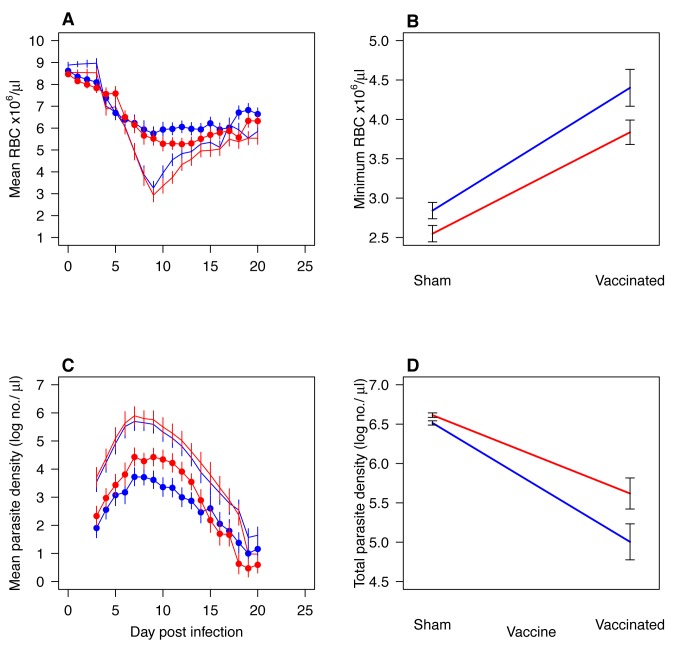
Figure 4. Virulence and densities of parasites that had been serially passaged 21 times in sham-vaccinated and AMA-1-vaccinated mice when assayed in sham-vaccinated or AMA-1-vaccinated mice (“evaluation experiment 4”).
Curves (A and C) represents the kinetics (mean ±1 s.e.m.) of five C-lines (blue) and five V-lines (red) when assayed in sham-vaccinated (no symbol) or AMA-1-vaccinated (filled circles) mice. The interaction plots show the minimum RBC (B) and total asexual parasite densities (D) reached during infection of sham- or AMA-1-vaccinated mice with C-lines (blue line) or V-lines (red line). During infection of sham- and AMA-1-vaccinated mice, V-lines induced more anemia than C-lines (A–B; F 1,38 = 4.0, p = 0.05 and F 1,38 = 4.0, p = 0.05, respectively), but the magnitude was not significant (A–B; anemia, parasite×vaccination: F 1,76 = 1.0, p = 0.3). V-lines and C-lines performed equally well in sham-vaccinated hosts (C–D: F 1,76 = 1.0, p = 0.3), and although V-lines achieved higher densities in AMA-1-vaccinated hosts (C–D; F 1,38 = 3.9, p = 0.05), the difference was not significant (Figure 4E–F; parasite×vaccination: F 1,38 = 1.9, p = 0.1).

