
Figure 3. Optical absorption of NFK-containing PSII peptides (A) and the model compounds (B), tryptophan, NFK, and kynurenine.
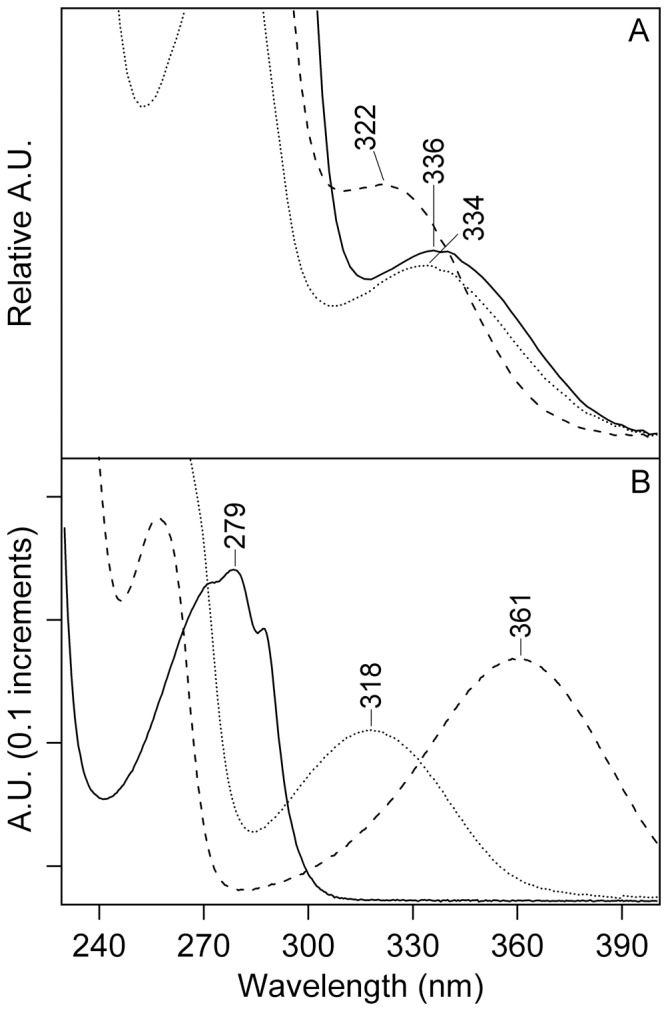
(A) shows absorption spectra of NFK-containing peptide fractions A–C. See Table S1, for average retention times from 350 nm chromatograms. Fraction A is displayed as a solid line, fraction B as a dashed line, and fraction C as a dotted line. In (B), absorption spectra of 40 µM tryptophan (solid line), 40 µM NFK (dotted line), and 40 µM kynurenine (dashed line) are shown in water. Absorption spectra in A were derived from the HPLC chromatogram and are on an arbitrary y-scale (see Materials and Methods). The spectra in B were measured on a Hitachi spectrophotometer (see Materials and Methods).