
Figure 2. Anti-CD25 Ab-induced depletion of CD4+CD25+ Treg cells in mice (n = 8–10).
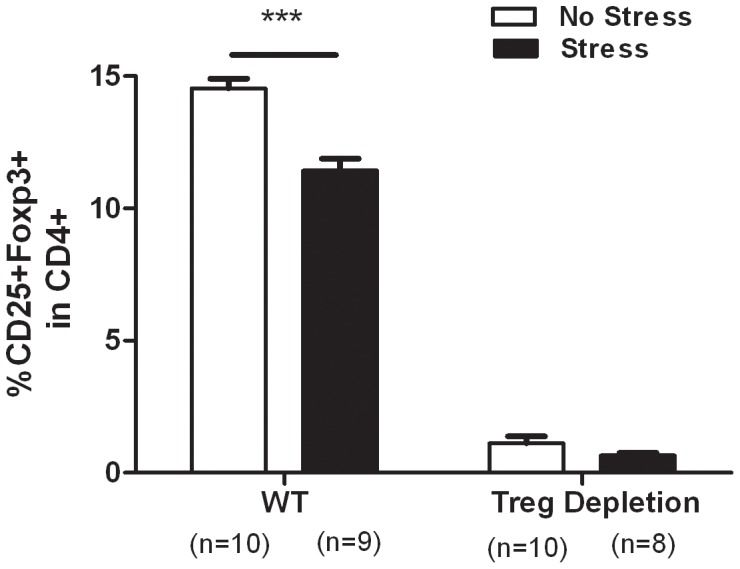
Representative dot plots are shown for CD4+CD25+FOXP3+ cells. The efficacy of CD4+CD25+ Treg cell depletion was confirmed by flow cytometry analysis using PE-anti-mouse CD25 and fluorescent isothiocyanate- anti-mouse CD4 (A). Summaries of the percentage of positive cells are shown in (B) for CD4+CD25+FOXP3+ cells and are presented as the mean ± SE. *** p<0.001 vs. the wild-type mice.