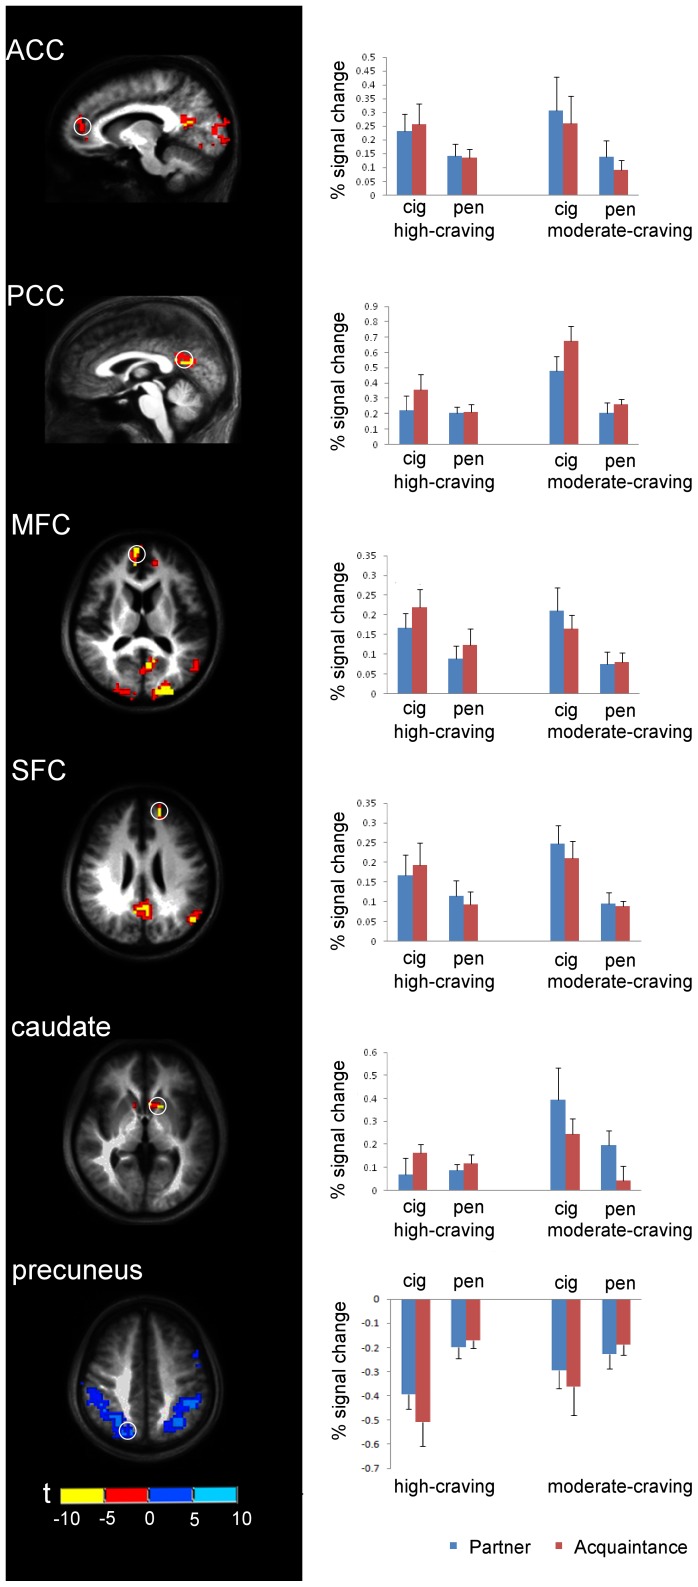
Figure 3. Region of Interest (ROI) analysis of the percent signal change of six ROIs for the four experimental conditions (partner+cig, partner+pen, acquaintance+cig, and acquaintance+pen).
The radius for each ROI sphere is 6 mm, VTA was 3 mm. The left line shows the location of each ROI (white circle), the right line shows the corresponding percent signal change for four experimental conditions. The center coordinates (Talarich coordinates)of each ROI sphere are: anterior cingulate cortex(ACC)(-10, 44, 9); posterior cingulate cortex(PCC)(-1,-61,17); middle frontal cortex(MFC)(8,44,14); superior frontal cortex(SFC)(-16,47,26); caudate(-13,11,2) and precuneus(14–70 41). The ROI regions ACC, PCC, MFC and SFC are defined from an activation map contrasting acquaintance+cig vs. acquaintance+pen in moderate-craving group; caudate is defined from an activation map of partner+pen vs. acquaintance+pen in moderate-craving group and precuneus is defined from an activation map of partner+cig vs. partner+pen in high-craving group.

