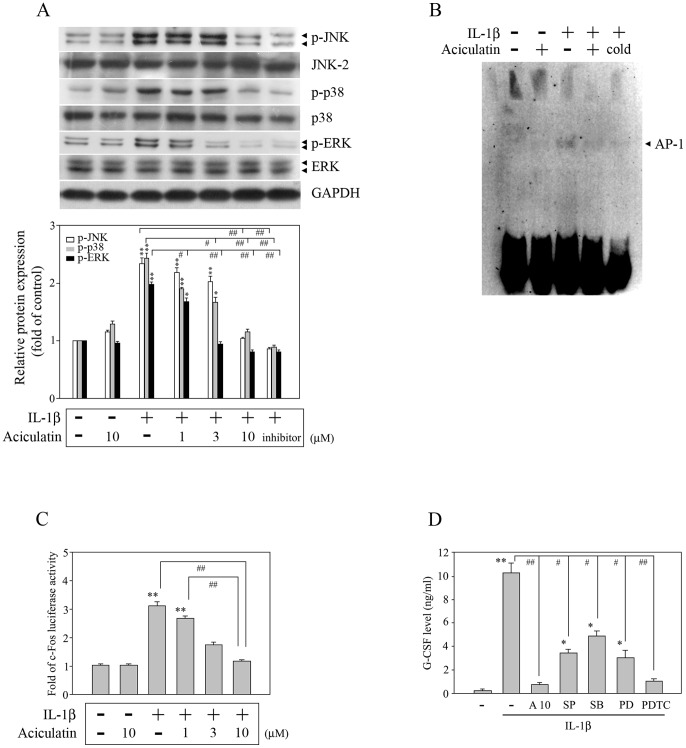
Figure 3. Aciculatin inhibits MAPK pathways.
(A) Cells were incubated for 30 min with 0–10 µM aciculatin or 20 µM SP600125 (a JNK inhibitor), SB203580 (a p38 inhibitor), or PD98059 (an ERK inhibitor), and then for 30 min with 10 ng/mL of IL-1β in the continued presence of aciculatin or inhibitor; a control with only 10 µM aciculatin was used. The cells were then harvested, and whole cell extracts were prepared for western blot analysis of the indicated proteins. The extents of indicated proteins expression were quantitated using a densitometer with a scientific imaging system, and the relative levels were calculated as the ratios of indicated proteins to GAPDH protein levels. (B) The cells were incubated with 0 or 10 µM aciculatin for 30 min, and then for 1 h with 10 ng/mL IL-1β in the continued presence of aciculatin; a control with only 10 µM aciculatin was used. Nuclear extracts were then subjected to a DNA-binding reaction with biotinylated oligonucleotides specific for AP-1. The DNA binding activity of the AP-1 complex is indicated by an arrow. (C) Cells (1×10⁵ cells) were transiently transfected with 1 µg of p5xATF6-GL3 for 24 h, and then incubated with 0–10 µM aciculatin for 30 min. The cells were then incubated for 6 h with 10 ng/mL of IL-1β in the continued presence of aciculatin, following which luciferase activity was measured. (D) FLS were incubated for 30 min with a vehicle, 10 µM aciculatin, or different inhibitors as indicated (20 µM), and then for 24 h with 10 ng/mL of IL-1β in the continued presence of aciculatin or inhibitor, before the supernatants were assayed for G-CSF by ELISA. In (A), (C), and (D), the results are expressed as the mean ± SEM, with n = 3. *p<0.05 and **p<0.01 compared with the control group; #p<0.05 and ##p<0.01 for the comparisons of the groups indicated.

