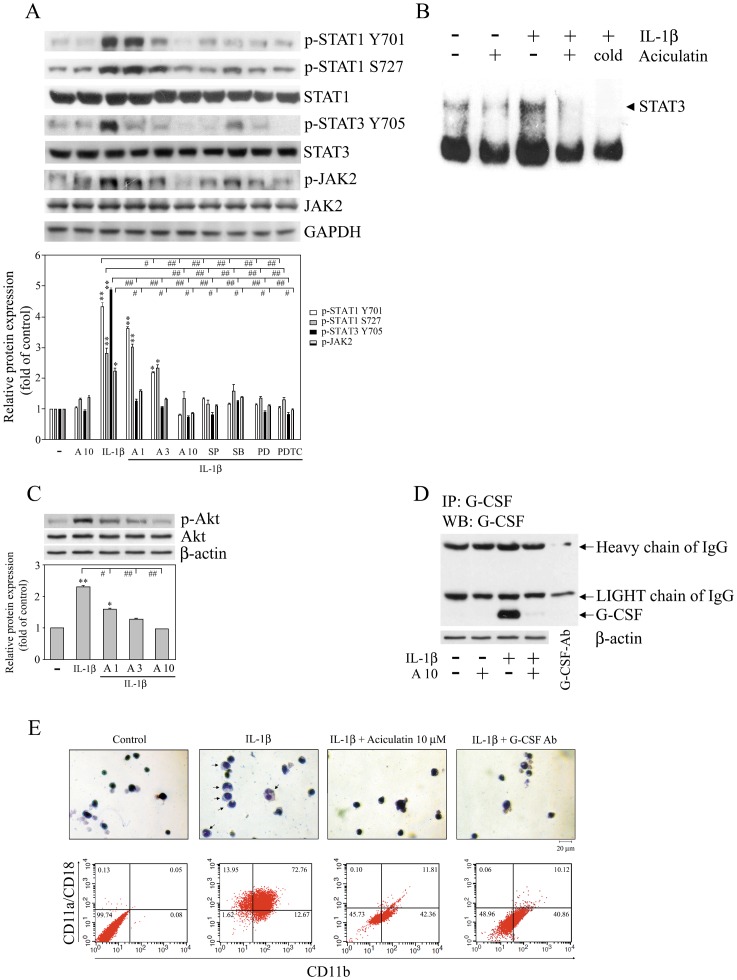
Figure 4. Aciculatin inhibits the phosphorylation of JAK, STAT, and Akt in FLS and the differentiation of 32Dcl3 cells.
(A, C, and D) FLS were incubated with 0, 1, 3, or 10 µM aciculatin (A1, A3, and A10) for 30 min, and then for 24 h with 10 ng/mL of IL-1β in the continued presence of aciculatin. Whole cell extracts were then prepared for western blot analysis for the indicated proteins (A and C); equal amounts of cell culture media (“conditioned medium”) were collected and concentrated 10-fold (v/v) (lanes 1–4) or PBS only (lane 5), and then immunoprecipitated with 1 µg of anti-G-CSF antibody, followed by immunoblot analysis using anti-G-CSF antibody or anti-β-actin antibody (as an internal control) (D). (B) FLS were incubated with 0 or 10 µM aciculatin for 30 min, and then for 1 h with 10 ng/mL of IL-1β in the continued presence of aciculatin. The DNA binding activity of the nuclear extracts was then examined in an electrophoretic mobility shift assay using a specific STAT3 DNA probe. (E) Ten-fold concentrated conditioned medium was prepared from FLS incubated with or without aciculatin, and then with IL-1β as in (D), or with IL-1β plus an anti-G-CSF antibody. 32Dcl3 cells were incubated for 10 days with a medium containing 50% of these different conditioned mediums. The cells were then were subjected to Wright-Giemsa staining to detect neutrophils (top row) or washed twice with PBS, incubated at 4°C for 45 min with anti-CD11b FITC-conjugated and anti-CD11a/CD18 PE-conjugated antibodies, and their fluorescence was analyzed by FACScan flow cytometry (bottom row). Magnification = ×100; scale bar = 20 µm. In (A) and (C), the extents of indicated proteins expression were quantitated using a densitometer with the Image-Pro plus software, and the relative levels were calculated as the ratios of proteins to GAPDH or β-actin protein levels. The results are expressed as the mean ± SEM, with n = 3. *p<0.05 and **p<0.01 compared with the control group; #p<0.05 and ##p<0.01 for the comparisons of the groups indicated.

