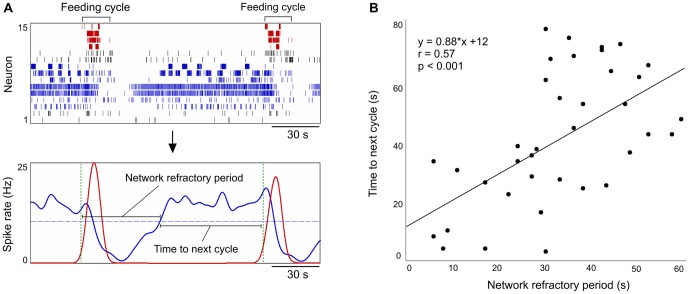
Figure 4. The duration of the network refractory period predicts the interval to next feeding cycle.
A. The continuous activity of the extra-CPG population (blue spikes) is transiently suppressed following a feeding cycle (red spikes). The network refractory period (NRP) is defined as the duration from the beginning of a feeding cycle, through the subsequent reduction of spiking in the extra-CPG population, to the time when the extra-CPG population returns to its average firing rate (indicated here with a dashed blue line). B. Plotting the duration of the NRP against the remaining inter-cycle interval shows that the timing of the next feeding cycle is significantly correlated with the duration of the NRP preceding it (r = 0.57, p<0.001, Pearson's linear correlation coefficient, n = 37 pairs of feeding cycles). The solid line represents best-fit linear regression.

